Introduction
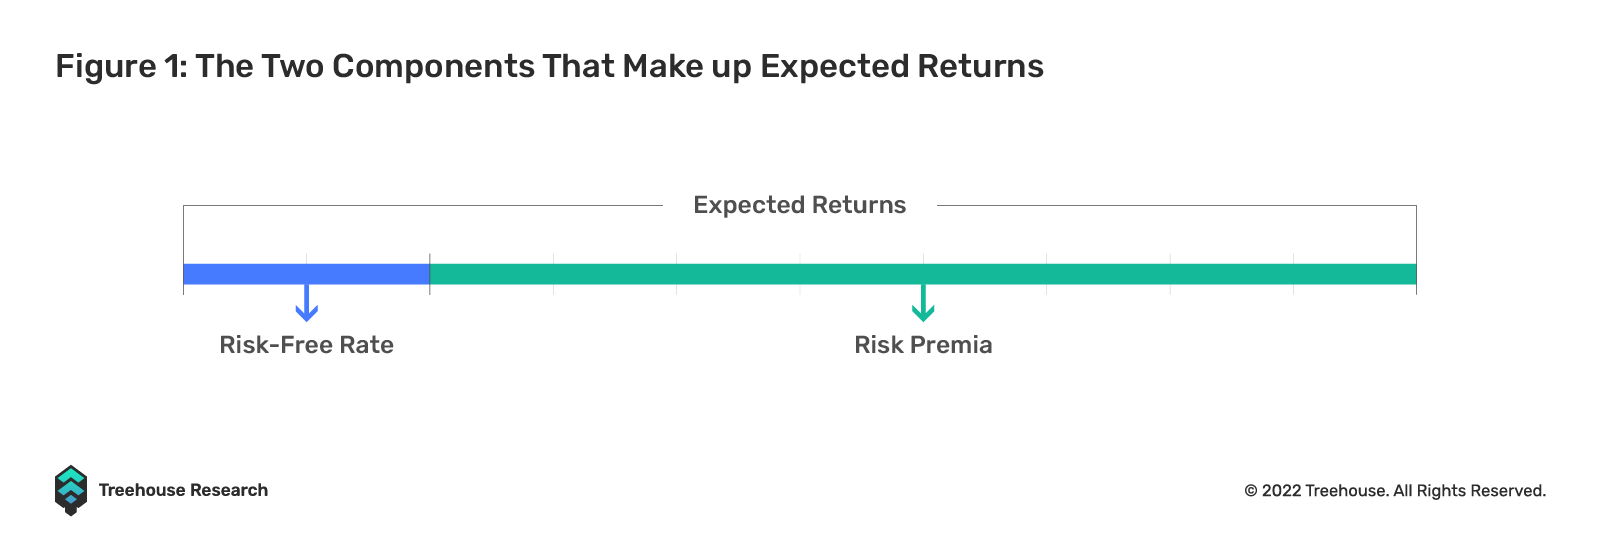
Risk premia stands for the expected return of an asset in excess of the risk-free rate of return. If a stock is expected to return 10% per annum (p.a.) while the risk-free rate is 2% p.a., then the stock’s risk premium is 8% p.a.
Because risk and return are two sides of the same coin, any sort of return can only be achieved by taking certain types of risk premium. Even widely perceived “risk-neutral” strategies such as arbitrage are often merely market risk-neutral strategies. As you will find, market risk only accounts for one spectrum of the full risk premium equation. For example, should ETHUSDT trade at a 2% difference on Binance and FTX, a simultaneous buy-low-sell-high trade would capture a market-neutral profit of 2%. The trader, however, is still exposed to certain inherent risks, such as the failure of withdrawal, settlement, or even a trade cancellation from either or both exchanges. In this case, the 2% profit is paid out to arbitrageurs taking risks, including but not limited to operational risks and Centralized Exchange (CEX) credit risks!
Understanding risk premia is important in risk management. By the end of this article, we hope to provide you with the necessary knowledge to look at your Decentralized Finance (DeFi) investments more comprehensively. Before providing our take on the types of risk premia in DeFi, we will first look at the common risk premia in Traditional Finance (TradFi). We also wrap up the article by providing some actionable insights into how Treehouse’s flagship product, Harvest, can help you dissect and manage your risks and returns better. If TradFi risks are not your thing, you may directly skip to section III where we discuss those specific to DeFi.
Risk Premia In TradFi
A. Risk-Free Rate of Return
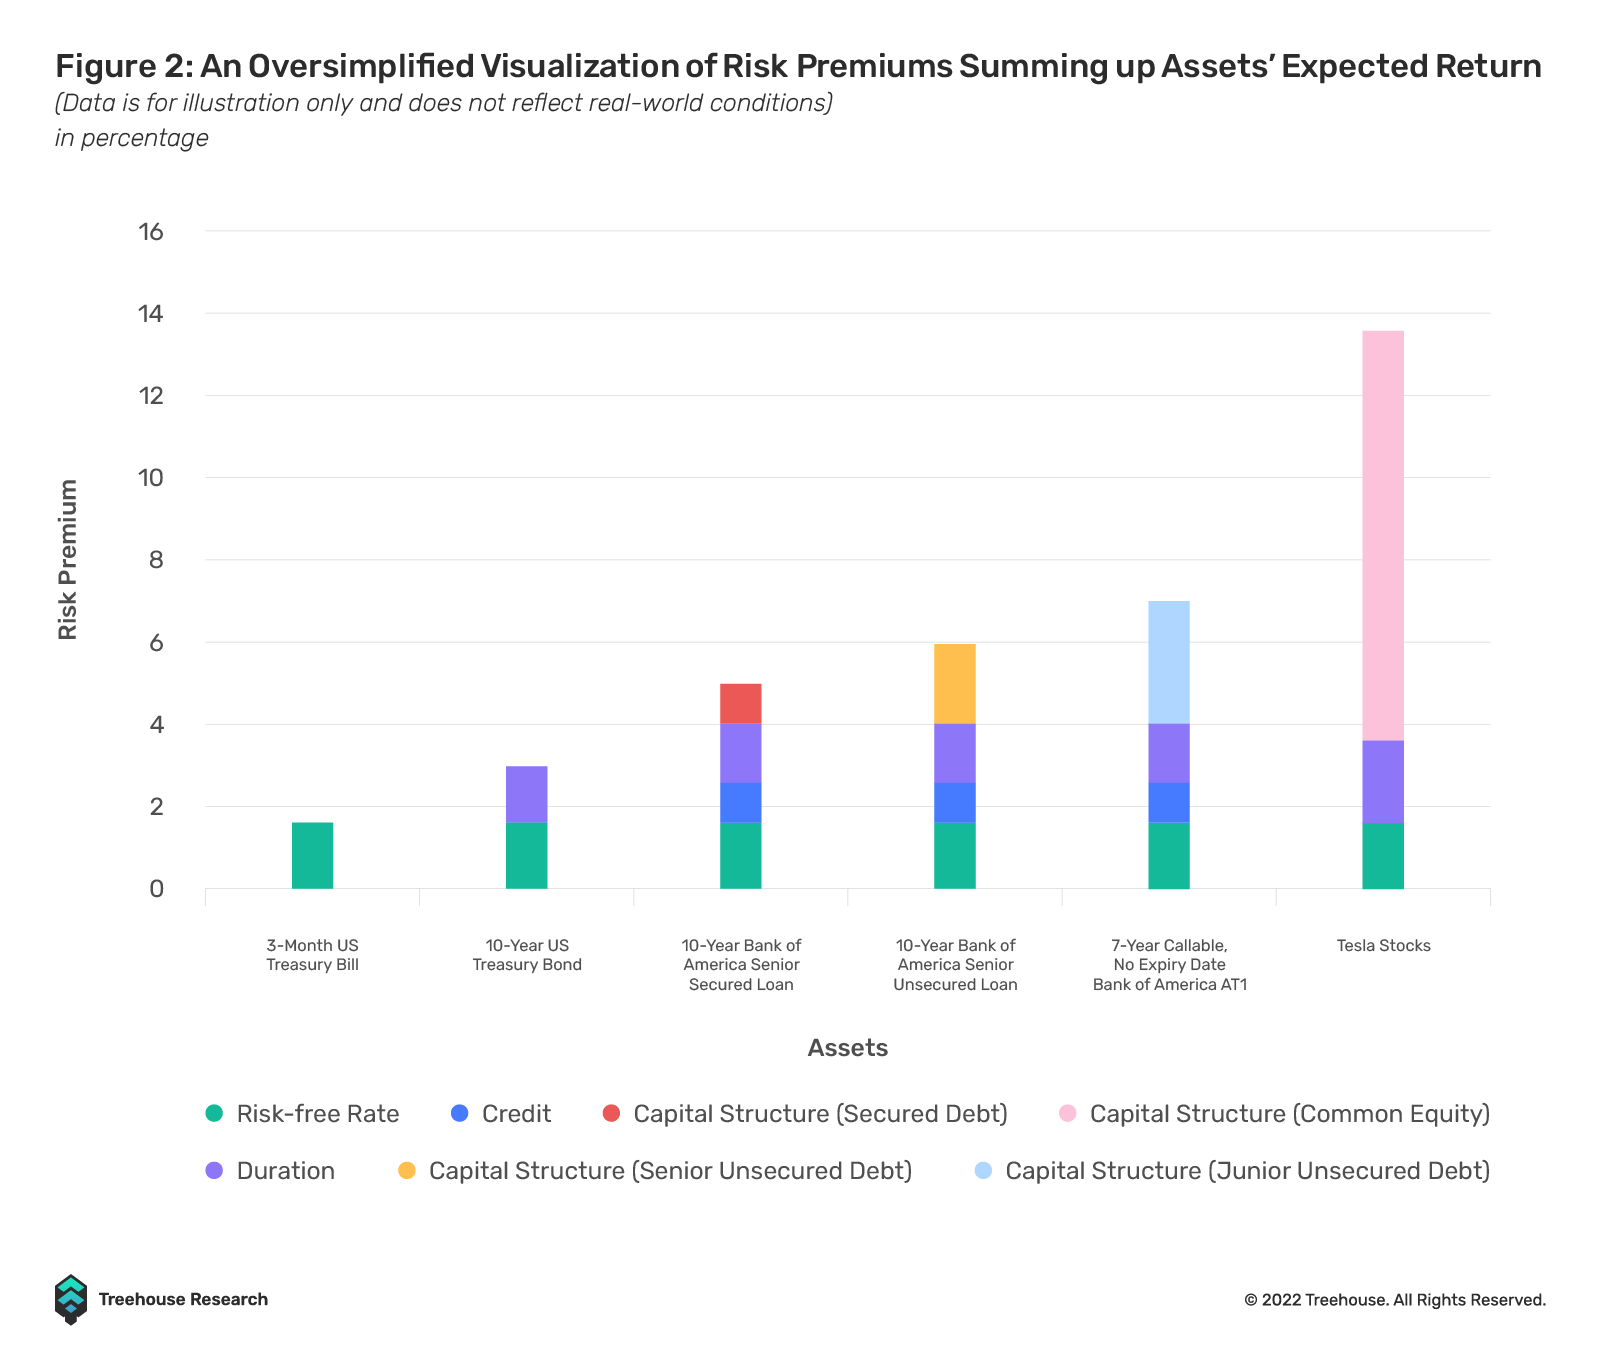
Since risk premia is a concept of excessive return, a risk-free benchmark must first be set. The conventionally agreed risk-free rate for USD assets is the return rate (yield to maturity, or YTM) of the 3-month US Treasury Bill (T-Bill). While other definitions exist, most of them revolve around short-term debt issued by the US federal government, which is reasonably trusted by market participants to honor its debts, at least in the short term. In this article, we will refer to the risk-free rate as the YTM of the 3-month US T-Bill unless otherwise specified.
For assets denominated in non-USD currencies, the relevant countries’ short-term central government debt yield can be treated as the local risk-free rate. Note that if the government of the United Kingdom (UK) borrows in GBP, it is technically risk-free in the UK because the government always has the option to print sterling and repay its debt. However, if the UK borrows in USD, there is a layer of risk involved, which will be touched upon in the Credit Risk section below.
Multiple factors impact the level of risk-free rates in the real world, including monetary policies, inflation, market supply and demand, and more. These factors are beyond the scope of this article.
B. Credit Risk
Credit risk, or default risk, is a risk premium that compensates lenders who lend money to anyone other than the US federal government. It reflects the market pricing of a certain borrower’s default probability. Common types of commercial borrowers who are not risk-free include municipalities, corporates, supranational agencies (e.g., African Development Bank), and foreign governments (specific to their USD borrowings). Personal borrowers are also treated with different rates depending on their credit history when borrowing via mortgages, applying for credit cards, etc.
Credit ratings, issued mainly by three major rating agencies – S&P, Moody’s, and Fitch – are widely utilized to assess the credit risk profile of borrowers. Credit bond spreads and Credit Default Swap (CDS) spreads are common instruments traded by market participants to express their views on credit risk premium.
C. Duration Risk
Duration risk mainly comes from two sources: probability of borrower default and opportunity cost of locking up capital for longer periods.
The longer the lending term until repayment, the larger the probability of borrower default. Imagine if a borrower had a 5% probability of default every year, i.e., a 95% probability not to default, then the probability of the borrower not defaulting after 5 years will roughly be 0.95 ^ 5 = 77%. This is why the market requires a risk premium to take on more duration risk.
The opportunity cost of locking up capital can also be explained as follows. If $100 is lent to a borrower for 5 years at 2% p.a., the lender will miss out on the yield upside for this $100 if the prevailing market rate (for the same borrower creditworthiness and lending terms) rises to 5%.
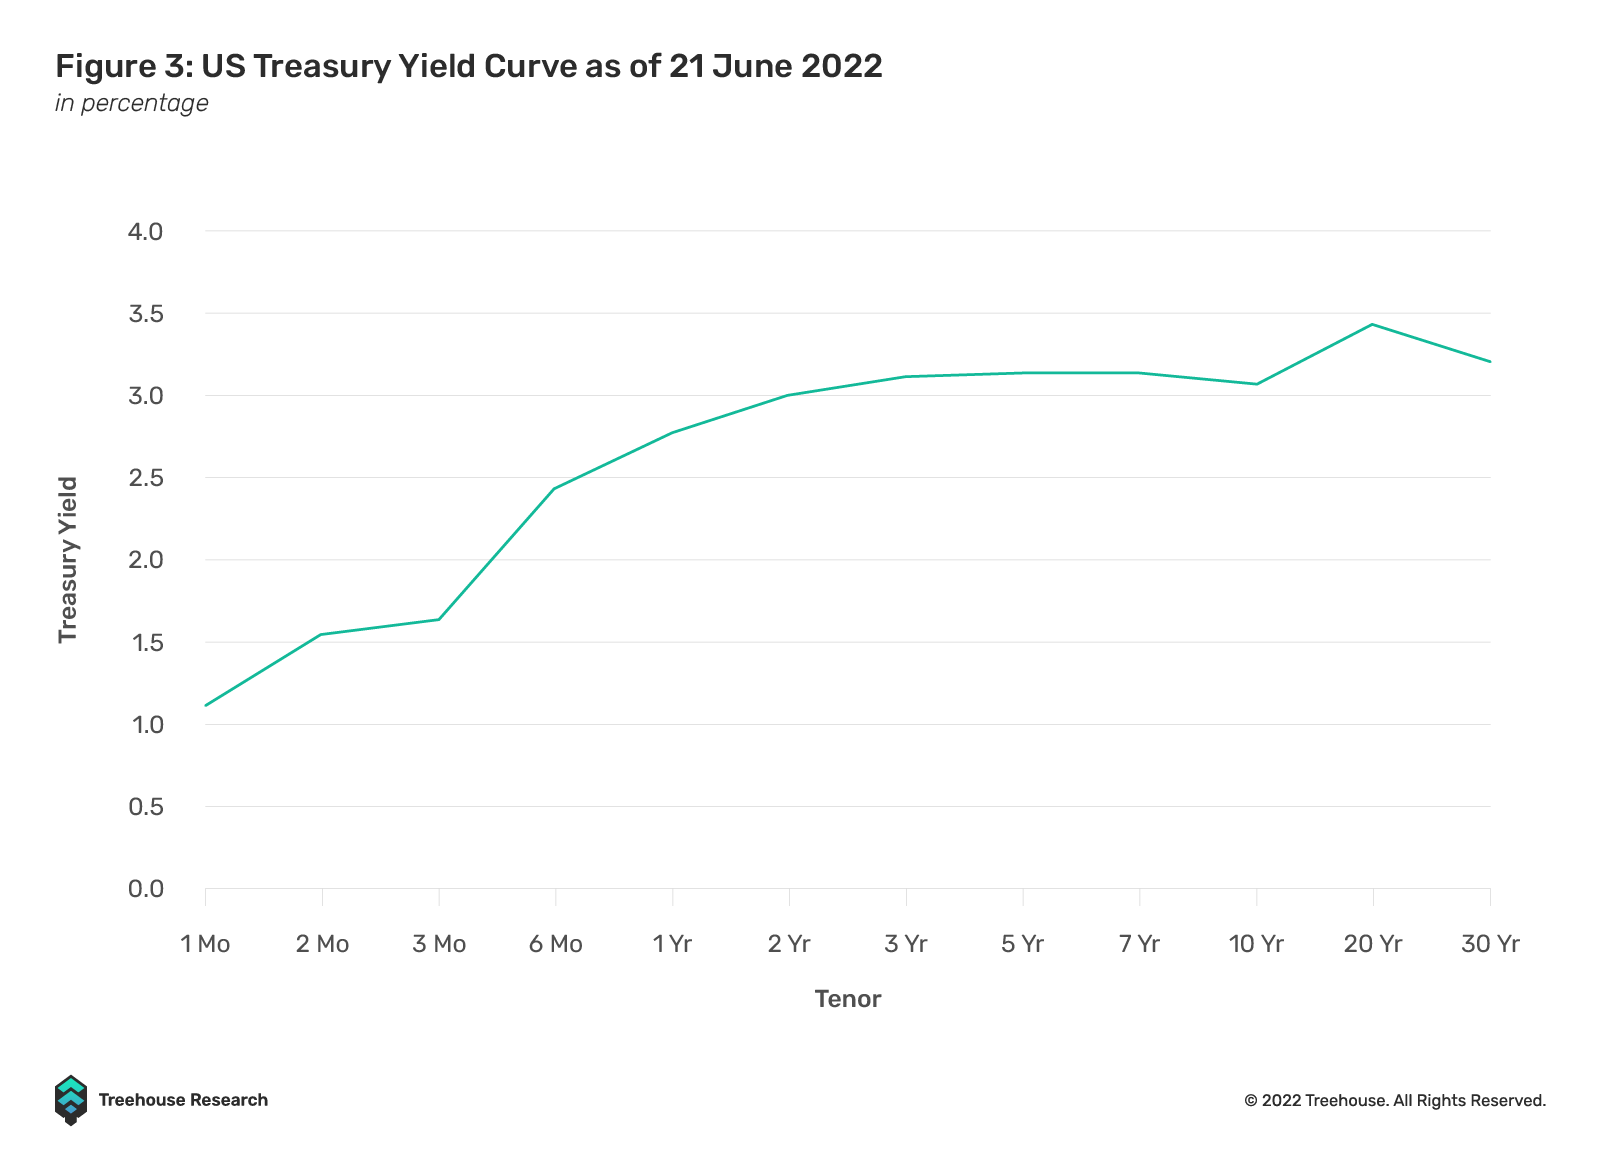
Duration risk premium is also referred to as term structure or yield curve in fixed income jargon. Even long-term US Treasury bonds without perceived issuer default risks have duration risk premia priced into their curves.
D. Capital Structure Risk
Below is a simplified introduction to capital structure that should not be treated as comprehensive.
1. Debt Holders
Debt holders are lenders extending loans and credit to an entity, taking debtors’ risk premia as compensation. The amount of credit and duration risks involved depends on the terms, as one entity usually has multiple lines of borrowings under different structures, e.g., secured (collateralized) vs. unsecured, senior vs. mezzanine, or junior.
In the event of default, debt holders are cushioned by equity and generally have higher priority to claim the entity’s assets for restructuring. Also, since debts are usually fixed income assets with a coupon, the income cash flow for debtors is more predictable. Therefore, debtors take on fewer risks than holders of other capital structure instruments and are compensated with less risk premium.
2. Equity Holders
Equity or stock has the lowest priority within the capital structure of an entity. This means that stockholders will see their shares wiped out to compensate for insolvency and to make debtors whole in the event of default. Cash income is unpredictable as dividends and buybacks are paid at a lower priority than interest to debtors. Equity investment has no “repayment” date and can only be exited if there is another willing buyer in the market, which is why stocks are viewed as instruments with infinite durations.
To compensate stockholders for the above risks, the equity risk premium is much higher, and in good times, stocks’ returns far outweigh those of debts.
E. Volatility
Volatility risk premium (VRP) is the compensation for providing protection. The source of VRP comes from human beings’ behavior of loss avoidance, which often results in overpaying for (mostly downside) protection in the form of put options. This is often why market-traded implied volatility (IV) are consistently higher than realized volatility (RV).
F. Factorization
While many academic studies on factor premiums of equities have been conducted, the Fama-French (FF) Three-Factor Model is probably the most classic.
r =rf + ß1(rm-rf) + ß2(SMB) + ß3(HML) + Ɛ
Where:
- r = Expected Rate of Return
- rf = Risk-free Rate
- ß = Factor’s Coefficient (Sensitivity)
- rm-rf = Market Risk Premium
- SMB (Small Minus Big) = Historic Excess Returns of Small-Cap Companies Over Large-Cap Companies
- HML (High Minus Low) = Historic Excess Returns of Value Stocks (High Book-to-Price Ratio Over Growth Stocks (Low Book-to-Price Ratio)
- Ɛ = Error Term (White Noise)
Before the FF Model, the Capital Asset Pricing Model (CAPM) argued that the expected return of a capital asset consists of the expected risk-free rate plus the asset’s risk premia multiplied by market beta.
r =rf + ß(rm-rf)+ Ɛ
Where:
- r = Expected Rate of Return
- rf = Risk-free Rate
- ß = Beta of expected excess asset returns to the expected excess market returns
- (rm-rf) = Market Risk Premium
The FF Model expanded on CAPM and included market capitalization (small vs. large cap stocks) and value (high vs. low book-to-market ratio) as factors. FF mathematically explained ~90% of stock returns, compared to CAPM’s success of ~70%.
Risk Premia In DeFi
Risk premiums in DeFi are both similar to and different from those in TradFi. In Treehouse Research’s article on DOVs and Strategies for DeFi Winter, we touched upon several risk premiums investors can earn returns from in DeFi. Here, we dive deeper into what risks investors are taking, both explicitly and implicitly, to earn “yield” in the DeFi space.
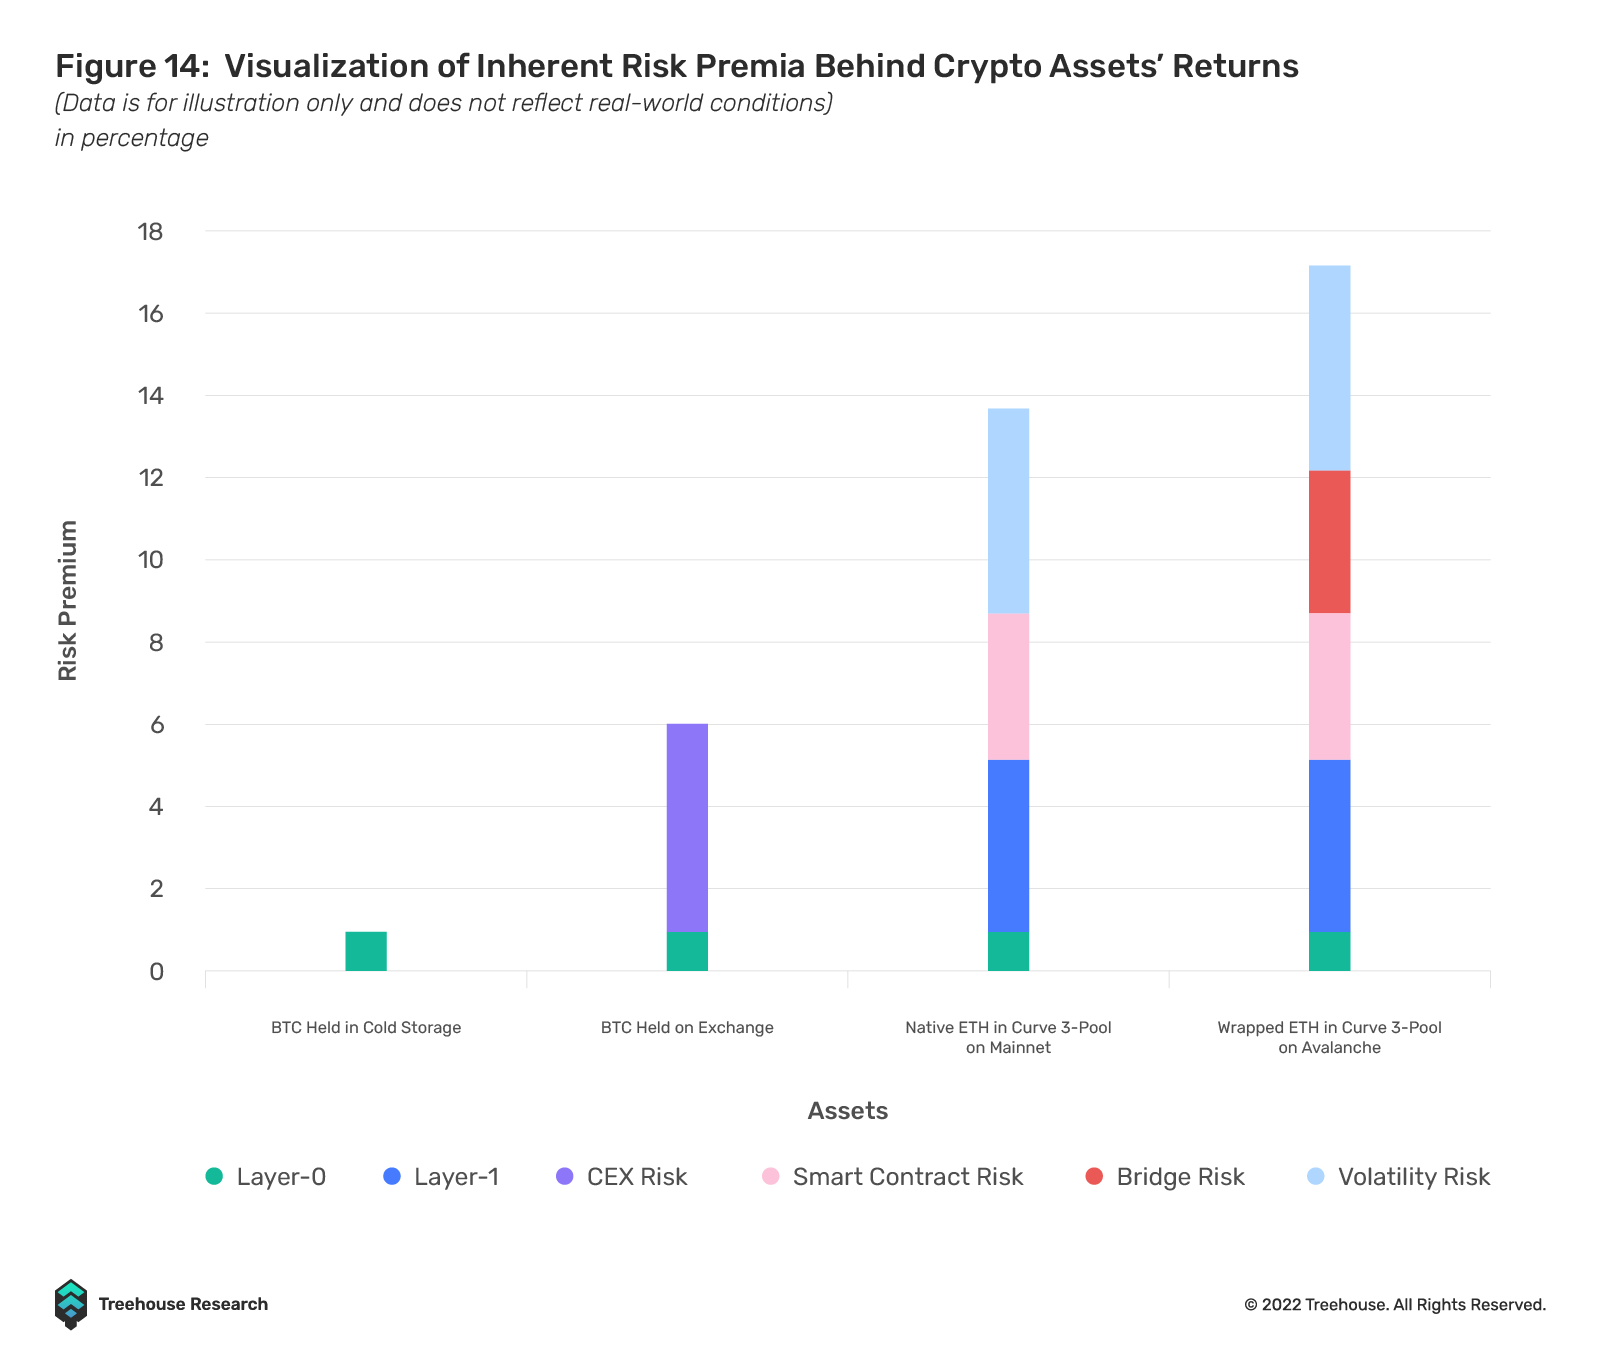
A. Layer 0 (L0)
Layer 0 risks are borne by all DeFi investors implicitly. Such risks are deemed extremely unlikely and thus will not generate any meaningful return for investors but exist nonetheless.
1. Internet Infrastructure
Proof-of-Stake chains exist fully in the digital domain and rely on at least some global internet infrastructure to remain operational. A theoretical risk exists: if major providers of internet infrastructure (e.g., Cloudflare) go down, digital assets may become inaccessible and even worthless.
2. DeFi Infrastructure
DeFi ecosystems use similar building blocks, which, if down, could impact the value of assets that rely on them.
a. Stablecoins
For an in-depth read on design mechanisms behind mainstream stablecoins, kindly find our stablecoins article published before Terra’s demise.
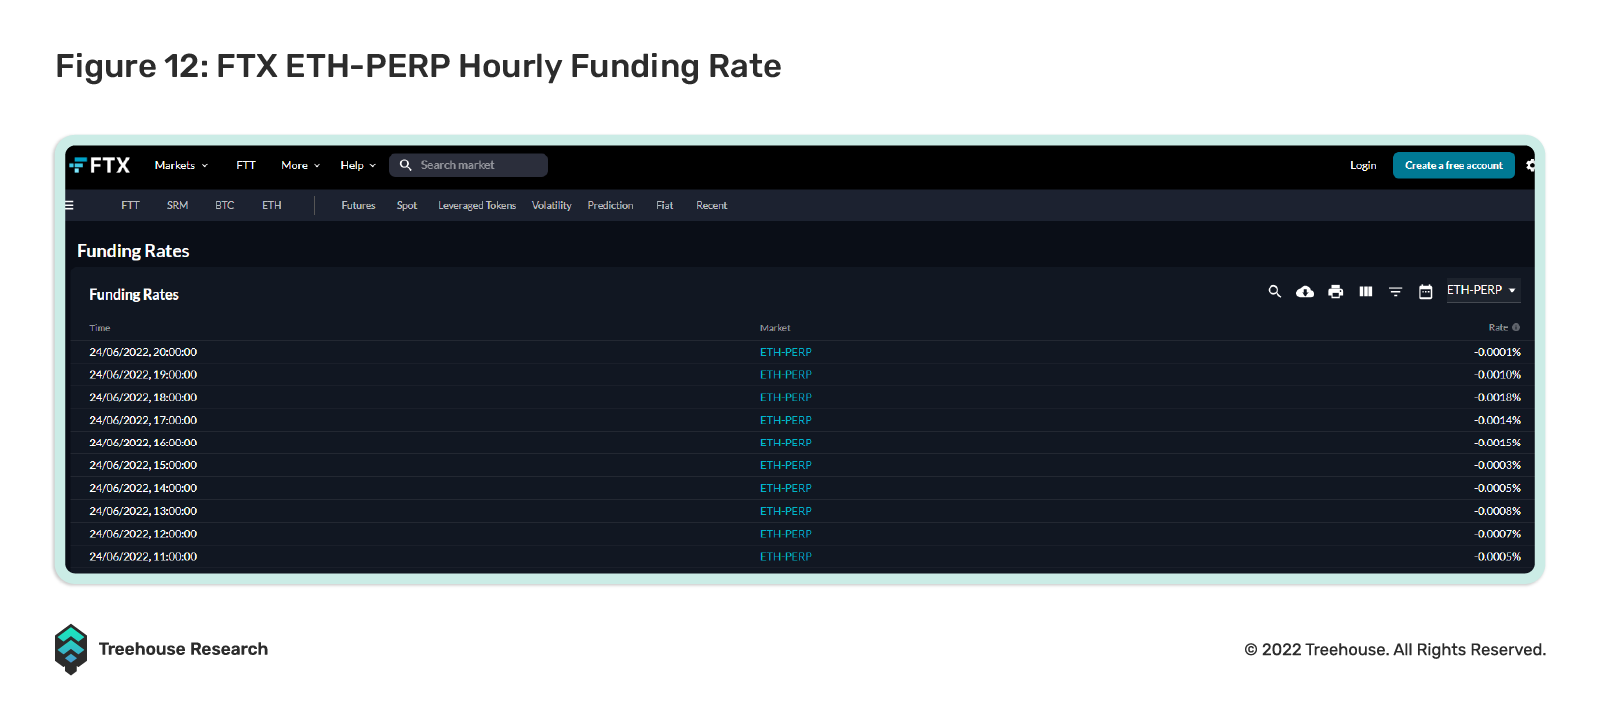
Stablecoins have become an essential medium of transaction among almost all DeFi ecosystems, and thus their depeg risks can have an asymmetric impact on investors’ capital. Before Terra’s implosion, stablecoins were arguably massively underpriced, as reflected in the highly negative funding rates seen on USDT perps leading up to June’s FOMC meeting. However, it seems they may now be overpriced due to the extreme fear in the market, especially given the Celsius/3AC situation.
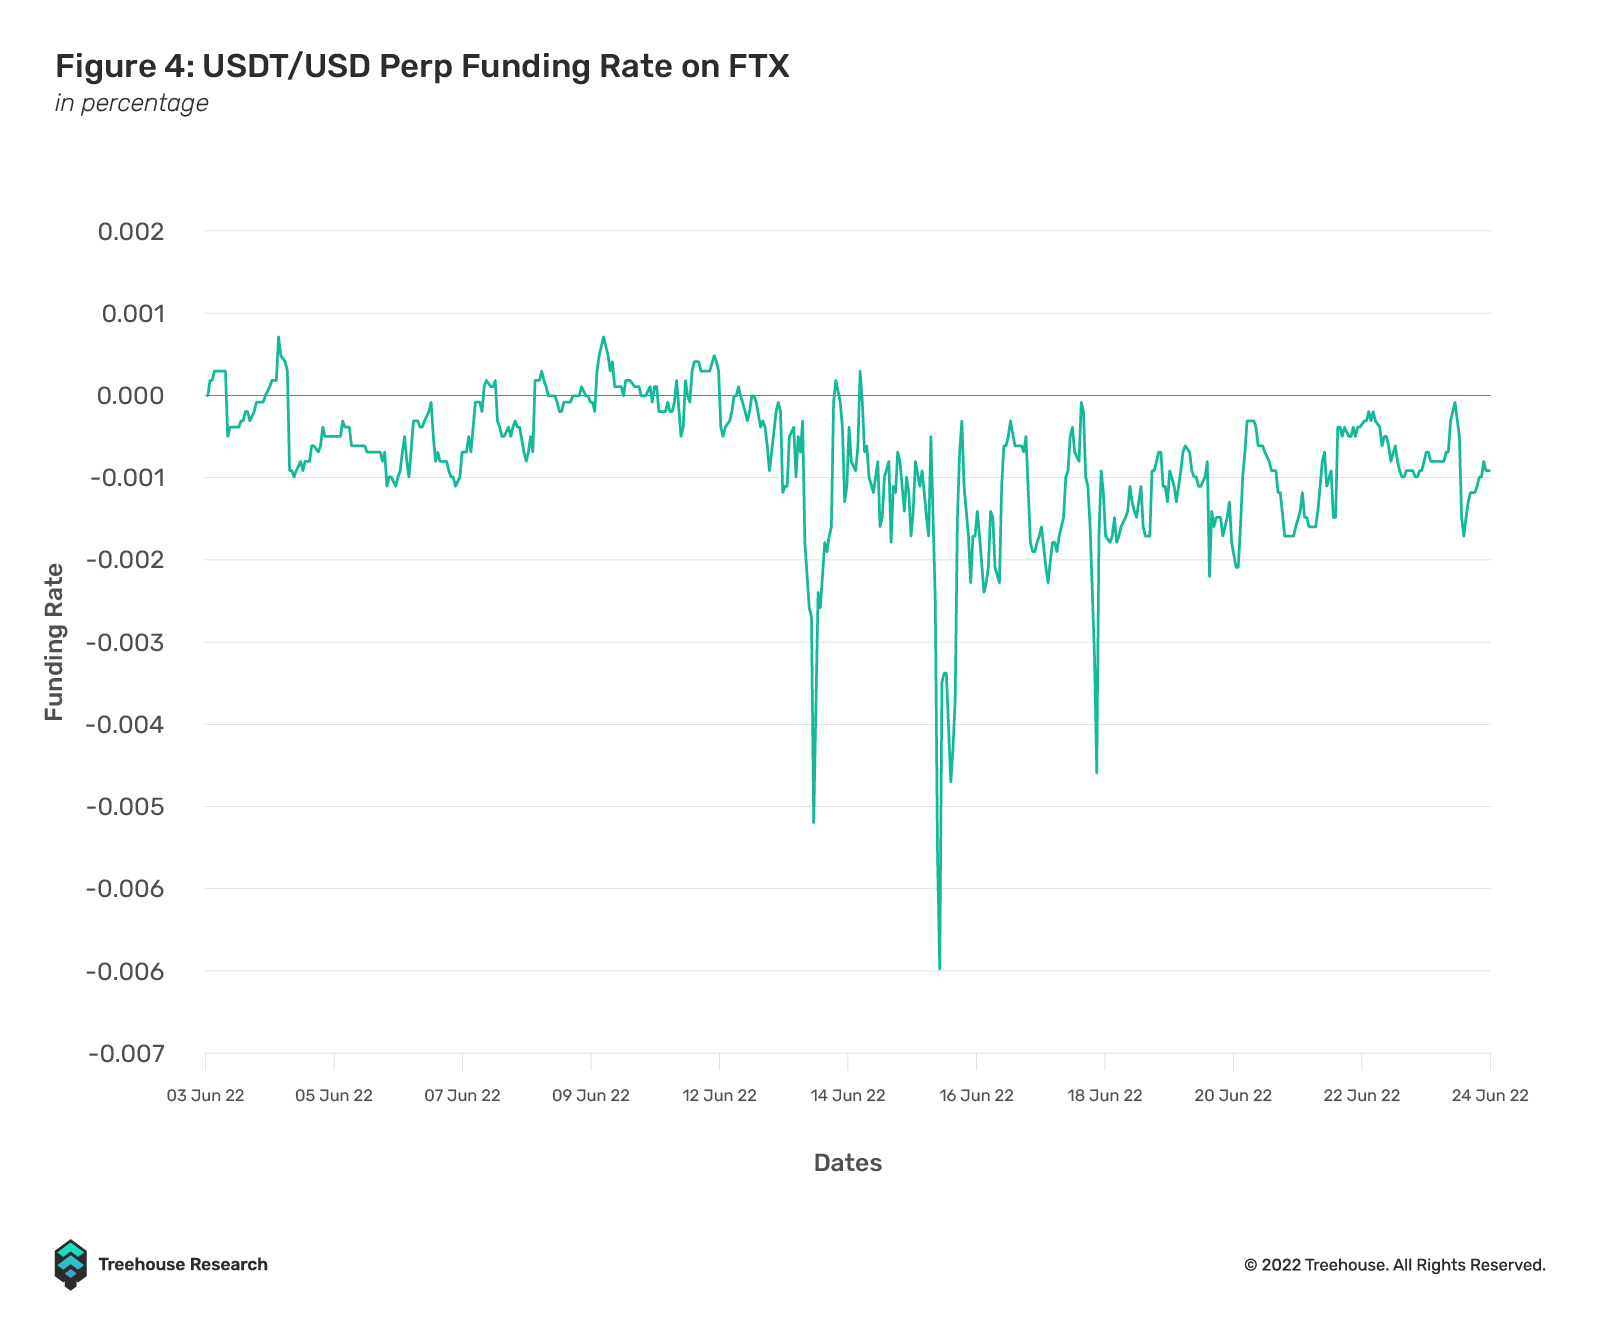
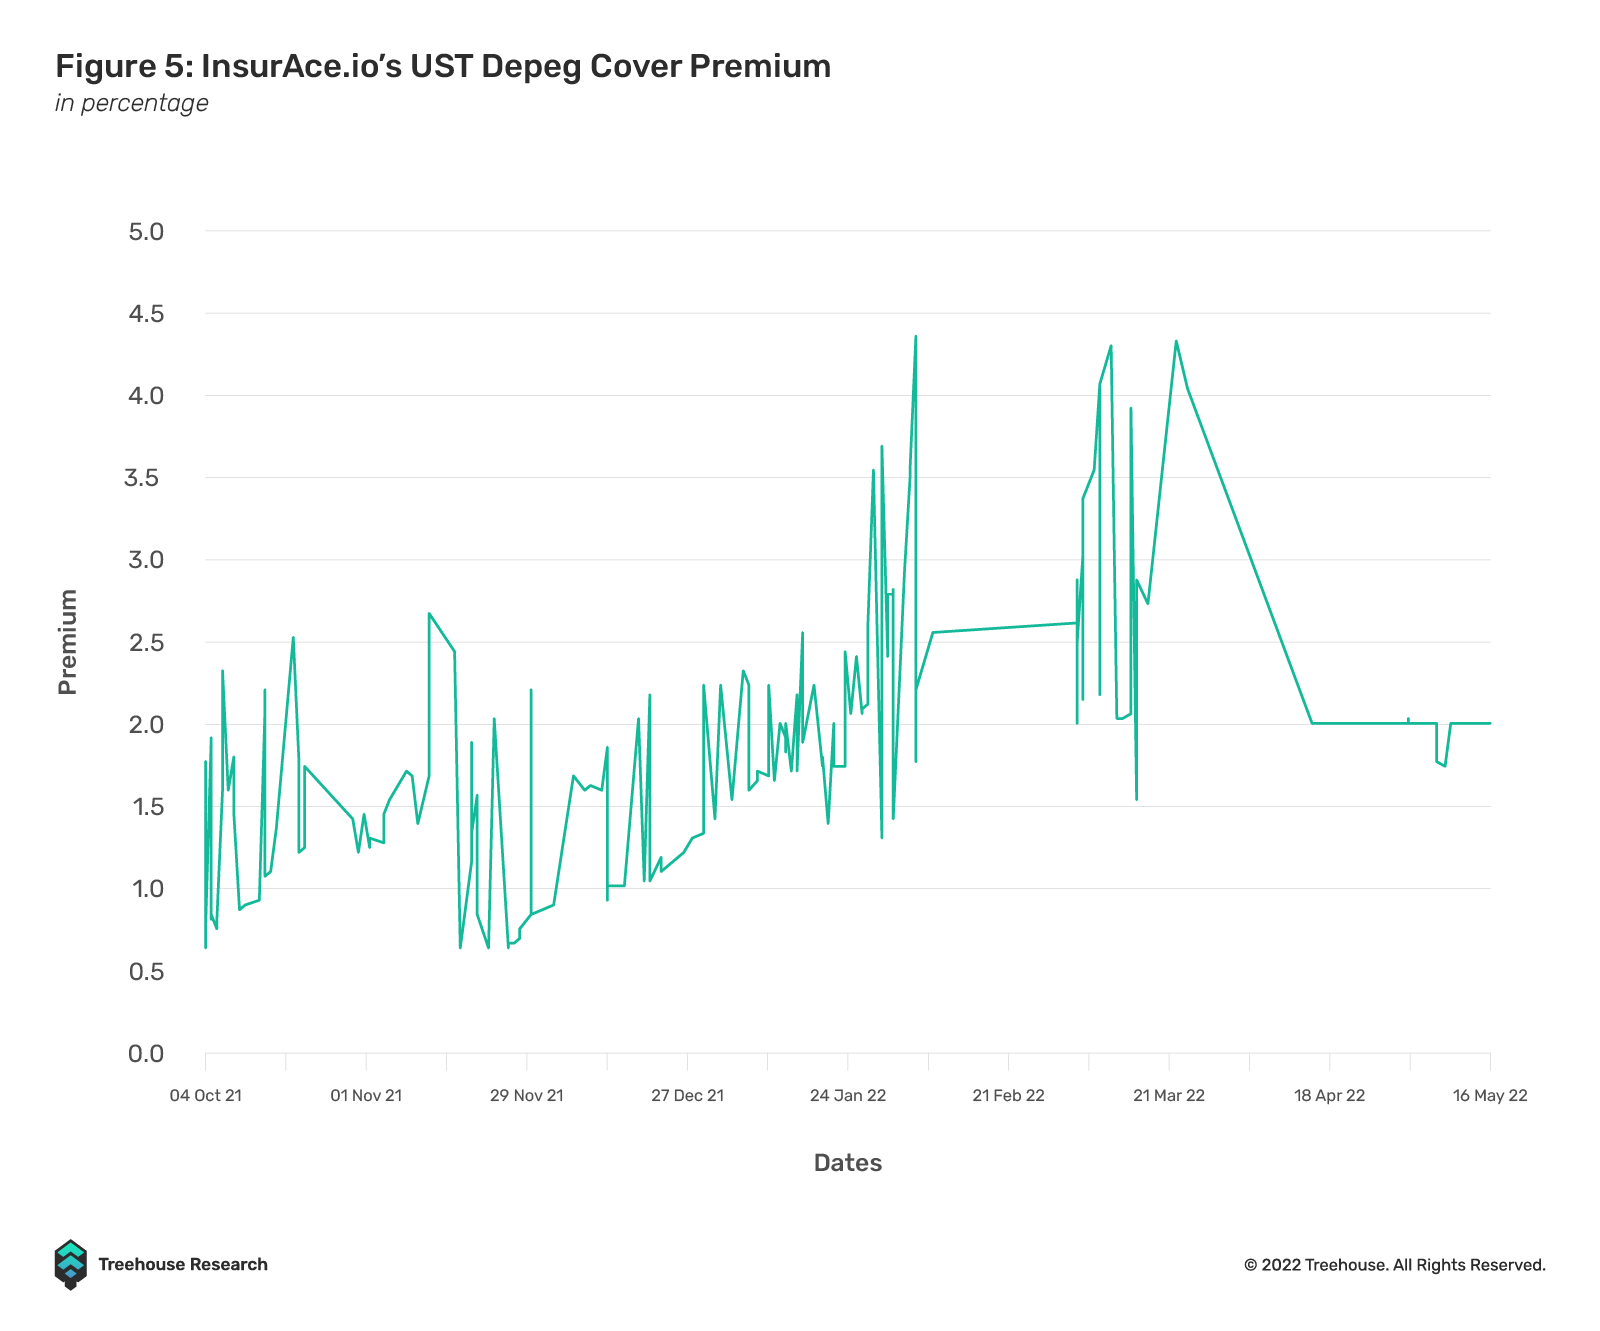
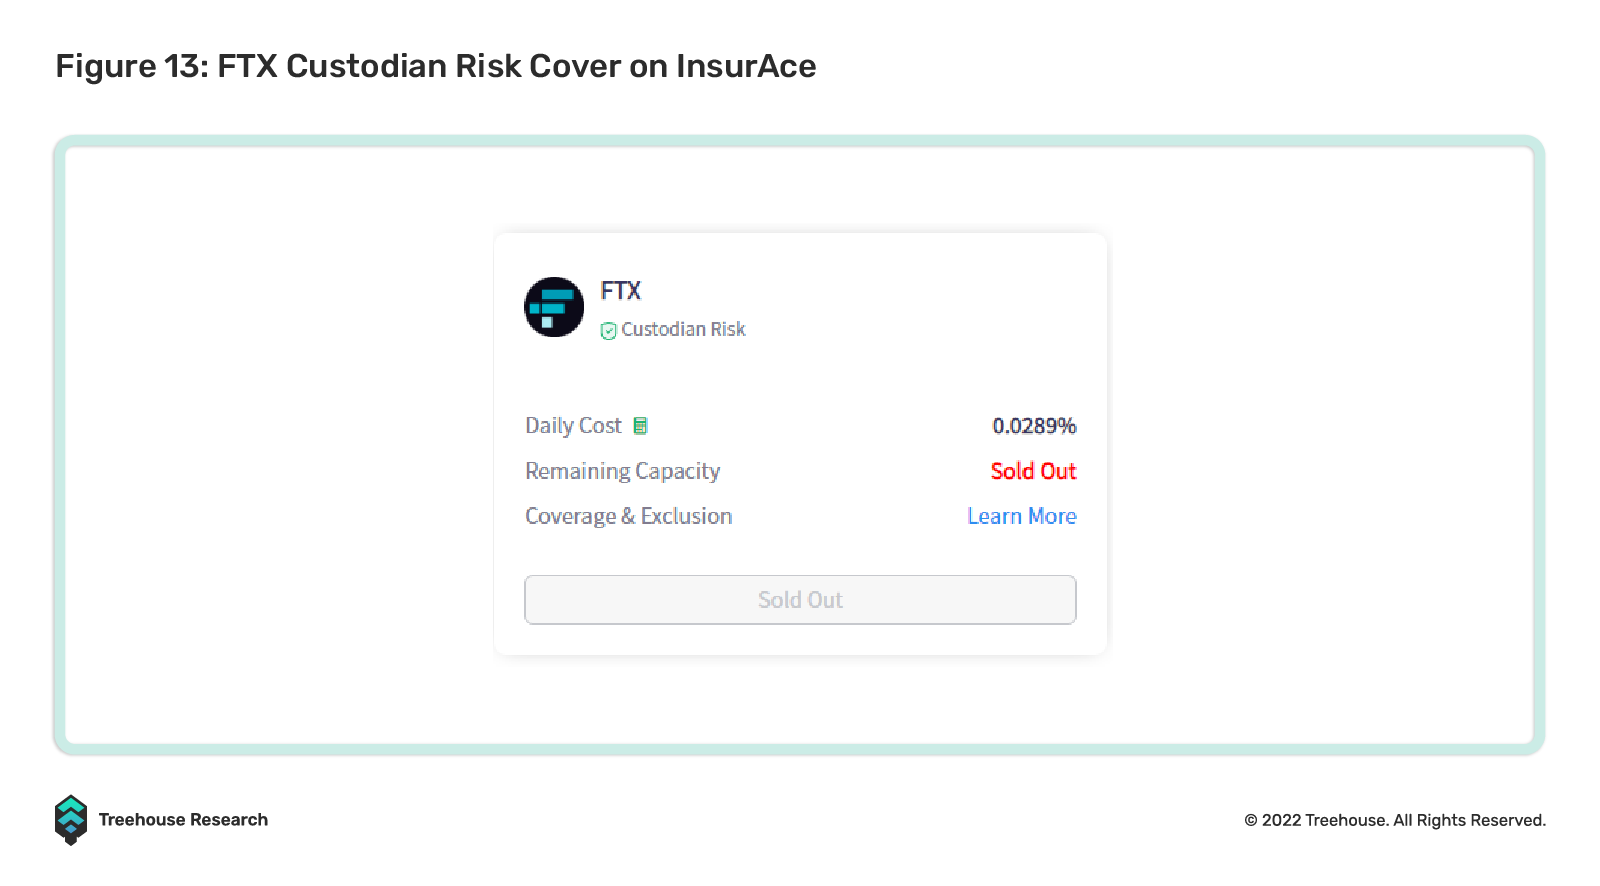
To quantify stablecoin risk premia, one can examine costs of proxy hedges such as relevant stablecoins’ perp funding rates and coverage premiums on DeFi insurance dApps such as Nexus Mutual and InsurAce.io. For perp funding rates proxy, De-Peg is defined very loosely, as a short stablecoin perp hedge will pay off even with the slightest price deviation from par. Most insurance premium proxies have different definitions of De-Peg (“claimable events”), and they often require meeting stringent criterias before the hedge pays off. That said, insurance coverage proved effective during the recent UST De-Peg event, where InsurAce.io paid out $11.7M to affected UST holders – the largest DeFi insurance payout to date. For more information on the InsurAce.io UST payout, please refer to the protocol’s detailed blog discussion here.
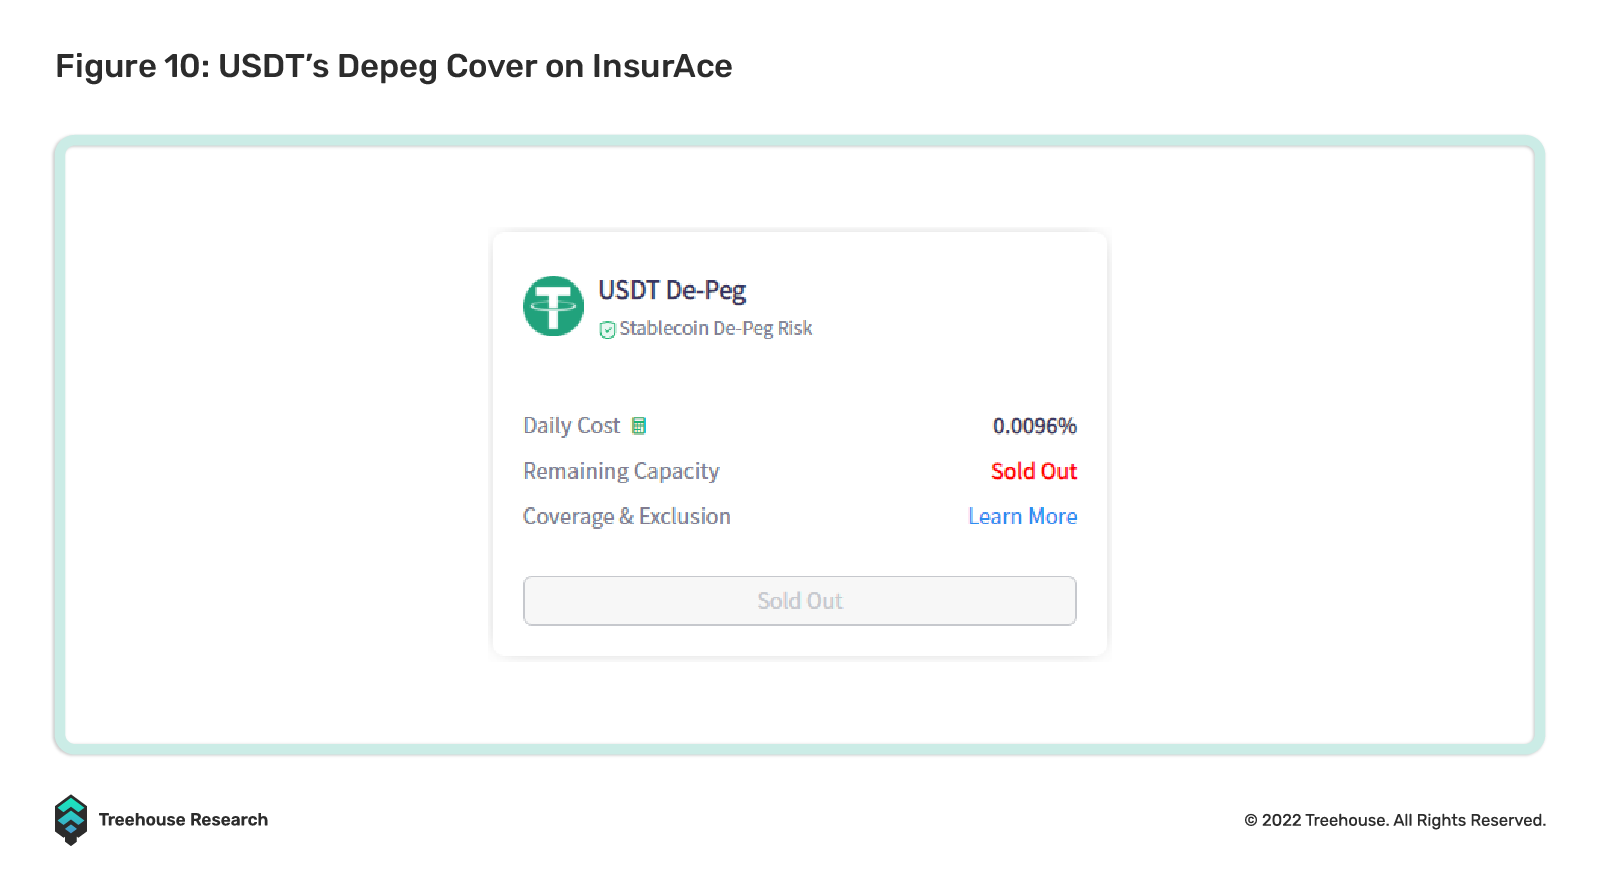
Since short stablecoin perp is always accessible and pays off hedgers easily, it can become exorbitantly expensive (deeply negative funding rates) during times of stress when hedges become crowded. On the other hand, insurance coverage might not be available to hedgers during market stress (i.e., “Coverage Sold Out”) since any reasonable person is unlikely to sell fire insurance on a burning house. We think the costs of these two proxy hedges can therefore serve as upper and lower bounds to estimate a “fair” stablecoin de-peg risk premia, albeit the range between bounds can be wide under different market conditions.
b. Wallets
Mass hacking or halting of popular wallet services can cause severe disruption to DeFi investors.
B. Layer-1 (L1)
At this layer, investors begin to get paid meaningful returns for taking relevant risk premiums. Several similarities can be drawn between L1 ecosystems and sovereign economies:
- Independent currency (gas token)
- Voters (governance token stakers)
- Current accounts (in-/outflow of TVL)
- Banking systems (DEXs, money markets, derivatives)
- Value creation in real economies (dApps that focus on creative content such as NFTs, intellectual property).
1. Chain Ecosystem Risks
a. Chain Infrastructure
Staking yield is the primary return rewarded to investors exposed to chain infrastructure. Stakers might lose their principal in events of slashing and major chain malfunctioning (e.g., an entire chain shuts down for a prolonged period, a chain hard forks with less than one-to-one payouts of the new tokens, validator corruption, etc.)
Some chains incentivize ecosystem participation with bonus tokens (e.g., AVAX Rush) at its early stage of deployment. Investors who harvest (“farm”) these returns also get compensated for taking chain infrastructure risks, as they sign up to be guinea pigs who risk losing capital in the event of an ecosystem malfunction.
C. Layer-2 (L2)
Rewards paid out by protocols to attract users can be viewed as another set of risk premiums.
1. Smart Contract Risks
a. Oracles
Malfunctioning of oracles could result in incorrect liquidations, protocol exploits, and many more issues.
b. Protocol Developer Credit Risk
Rug pull risks are important to consider when conducting due diligence, as the impact on capital drawdown is severe and usually irrecoverable.
c. Bugs, Hacks, and Malfunctions
Even for well-developed protocols with credible teams behind them, dApps can still be exploited due to previously undiscovered glitches. These event risks are predominately implicit, but we can proxy them using insurance premiums as explained before.
For example, InsurAce.io and Nexus Mutual offer protocol covers with claims paid when protocol users suffer material financial losses due to failures in the protocol code, economic design, governance attacks, or oracles.
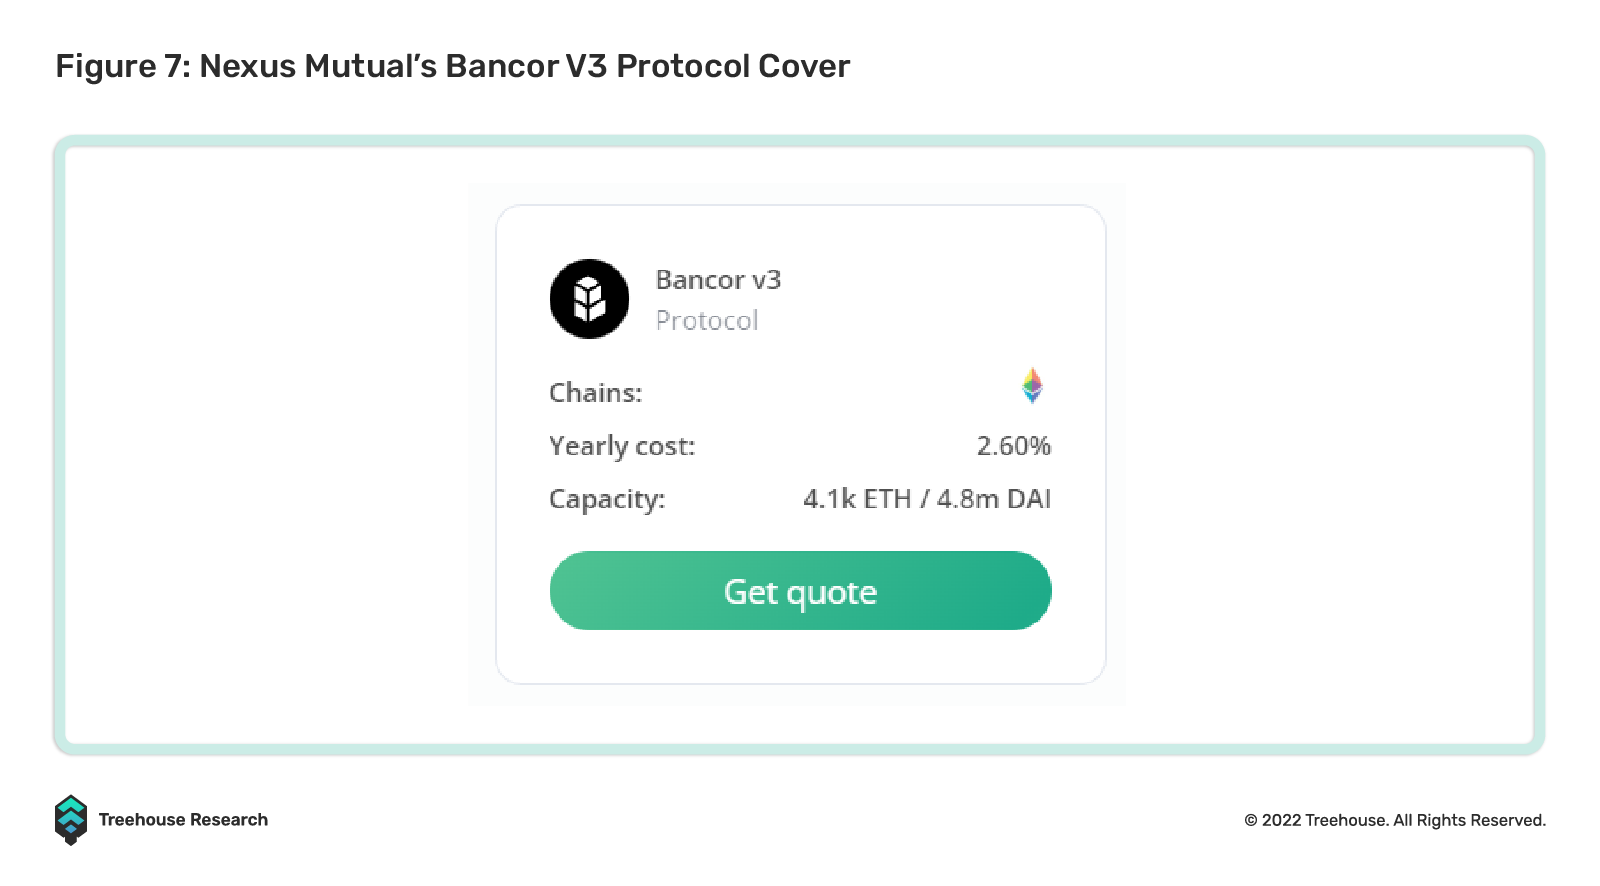
Investors wishing to harvest these risk premia can earn yields by selling insurance in such pools. However, the availability of pools is subject to having enough investors pooling together to sell insurance. The riskiest protocols lack enough willing insurance sellers, resembling how the riskiest extreme sports (e.g., parachuting, heli-skiing) have few insurance coverages available.
d. Tokenomics Design Deficiencies
Do credible developer teams and triple code audits guarantee a successful token performance? Not necessarily.
Failure in designing sustainable tokenomics is an inherent risk that investors take when having exposure to newly founded protocols that give out generous token rewards.
We recommend reading Jump’s recent piece on Token Design for a deeper dive!
2. Bridges
Crossing chains is a common but potentially risky endeavor. Bridge hacks are not uncommon, and liquidity-based bridges can see wrapped tokens stuck on a chain without liquidity inflow. Risk premiums associated with bridges are currently hard to isolate, even with proxies. Major DeFi insurance protocols have limited coverage on bridges, and the claimable events that trigger insurance payouts are quite limited.
3. Liquid Staking Protocols
This increasingly popular yield-generating strategy has come under scrutiny during the Celsius liquidity crunch. Although liquid staking protocols are one-to-one and hence will not face actual insolvency, loss of parity between liquid staked and native tokens can still happen.
In essence, liquid staking is akin to an auto-rolled short position on native token liquidity. Price differentials between liquid staked and native tokens reflect the price of such liquidity. If the market panics and overpriced liquidity, liquid staked positions will suffer mark-to-market losses, even though these losses are unrealized until holders decide to (or are forced to) sell.
The difference in liquid staking mechanisms also affects the risk premia. Lido’s stETH, for example, is staked on Ethereum’s Beacon Chain and has its withdrawals disabled until The Merge happens. This is why the market does not trade stETH at parity with ETH at the moment. BENQI’s sAVAX and pSTAKE’s stkATOM, on the other hand, do not face such issues, as anyone willing to sell liquidity can buy depegged liquid staked tokens and wait through the unstaking period to capture the risk premia.
D. Market Risks
This category of risk premia is probably the most studied, and a plethora of instruments are available for investors to express views on them.
1. Risk-free rate
The fiat-centric investor might choose to use a short-term US T-Bill’s YTM as the risk-free rate when evaluating DeFi risk premia. After all, most crypto assets are denominated in USD, making the fiat-centric view legitimate and probably fairest to evaluate returns against other USD assets such as equities, bonds, and commodities.
Crypto-native investors, however, might argue for different risk-free rates, as benchmarking against the US T-Bills’ YTMs violates one of the main ethos of DeFi—decentralization. Drawing from DeFi ecosystems’ similarities to sovereign economies, we present a sensible analogy to arrive at a crypto-native risk-free rate below.
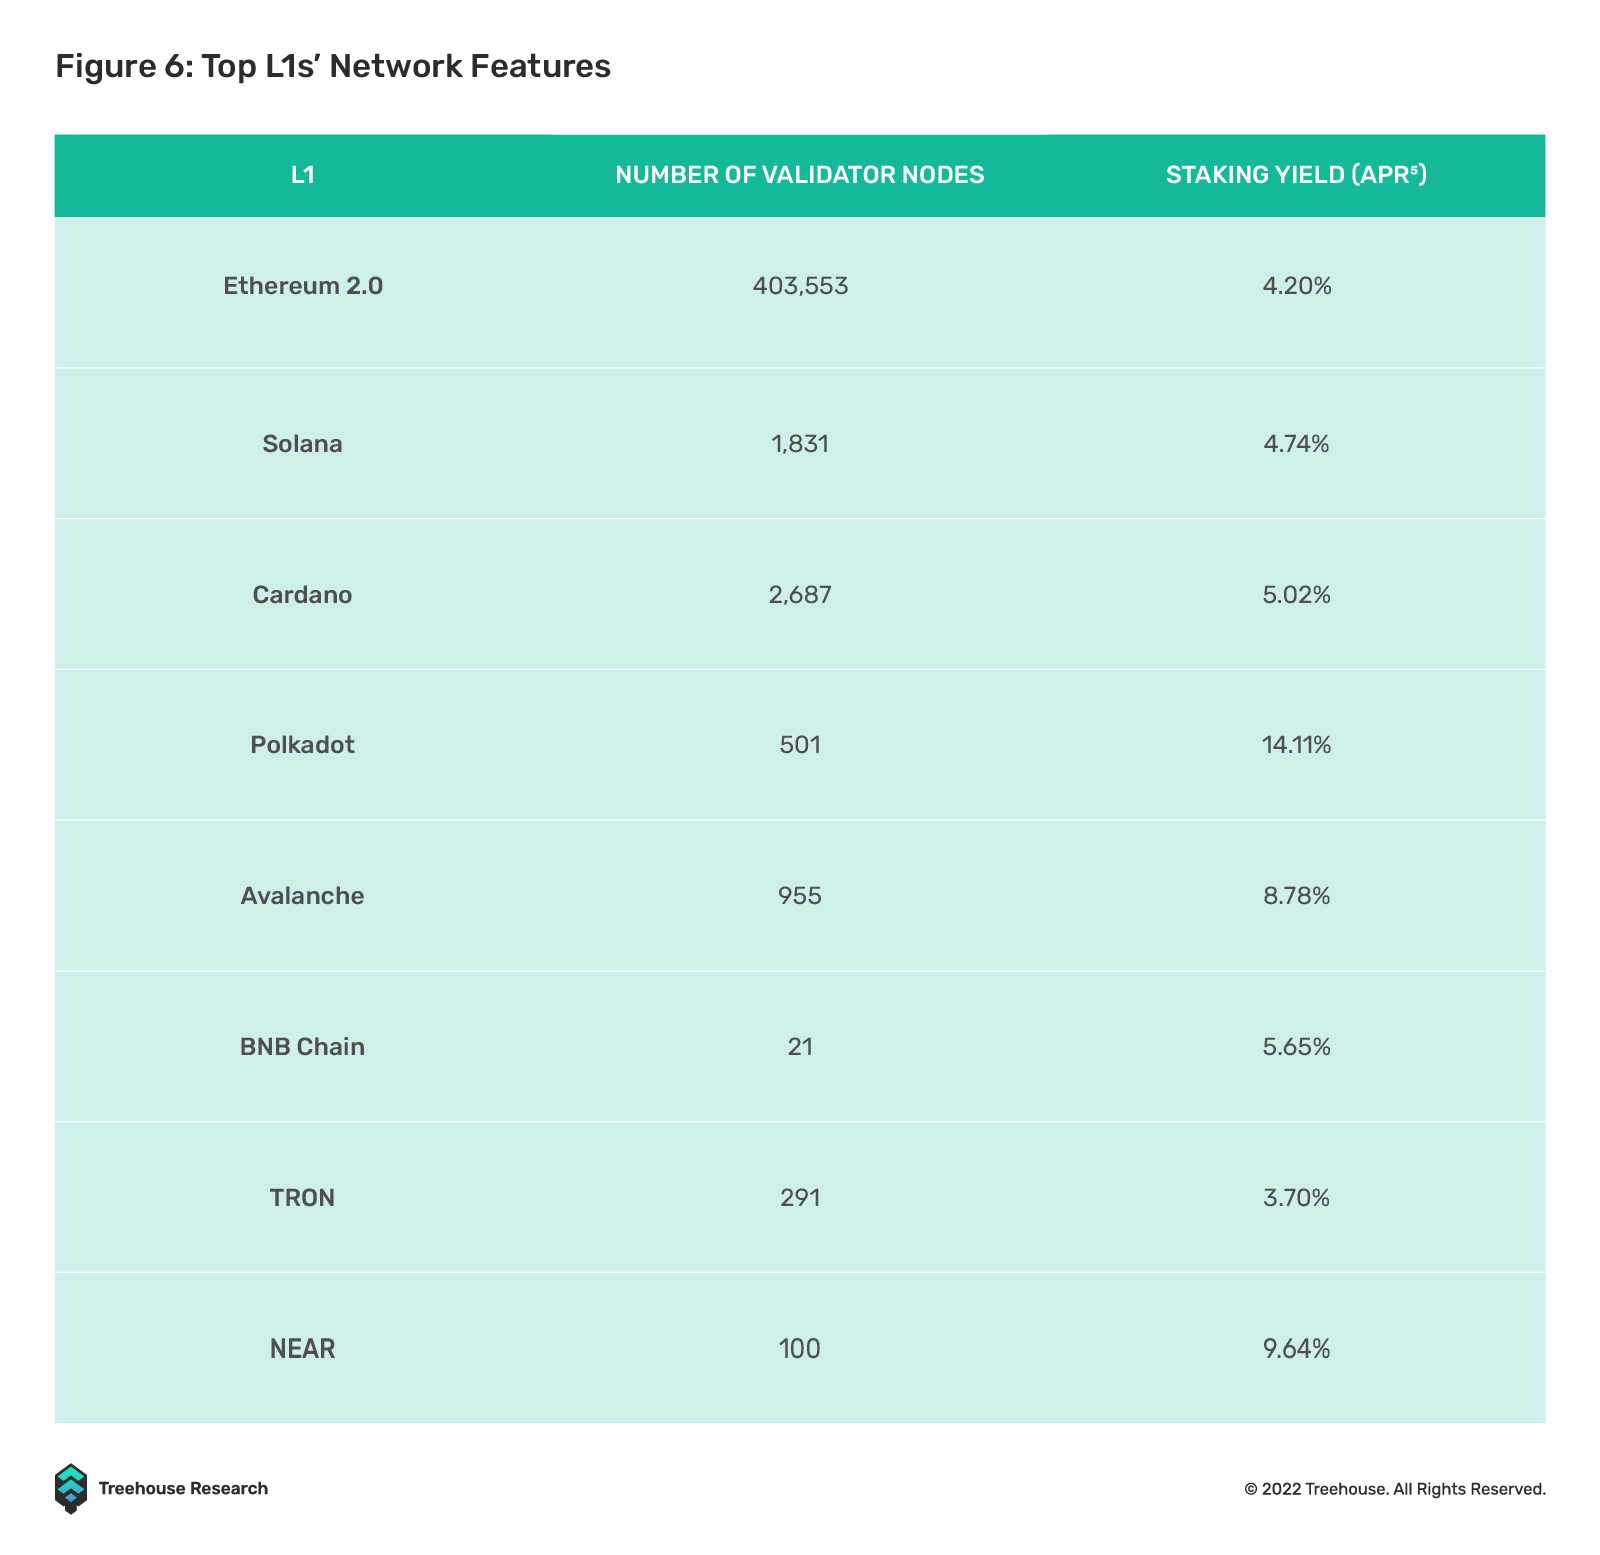
The crypto blue chips, BTC and ETH, can be likened to the United States and jointly form the strongest economies in DeFi. As such, the median miner’s yield in BTC terms and native staking yield in ETH terms can possibly be regarded as risk-free rates for the reserve digital currencies.
Similarly, leading L1 tokens can be compared to TradFi’s “hard currencies” such as Sterling, Euro, Yen, Canadian Dollar, Swiss Franc, and the Australian Dollar. The staking yields of L1 tokens are similar to the local currency short-term government debt YTMs in these hard currency countries (e.g., 3-month Gilt yield).
Another proxy of solving for the risk-free rate is to start with any yield in DeFi and then hedge all tradable risks associated with this yield to leave only its “risk-free portion”. This proxy has obvious drawbacks, as many risk premiums mentioned above are not yet tradable. Nonetheless, we provide an example below!
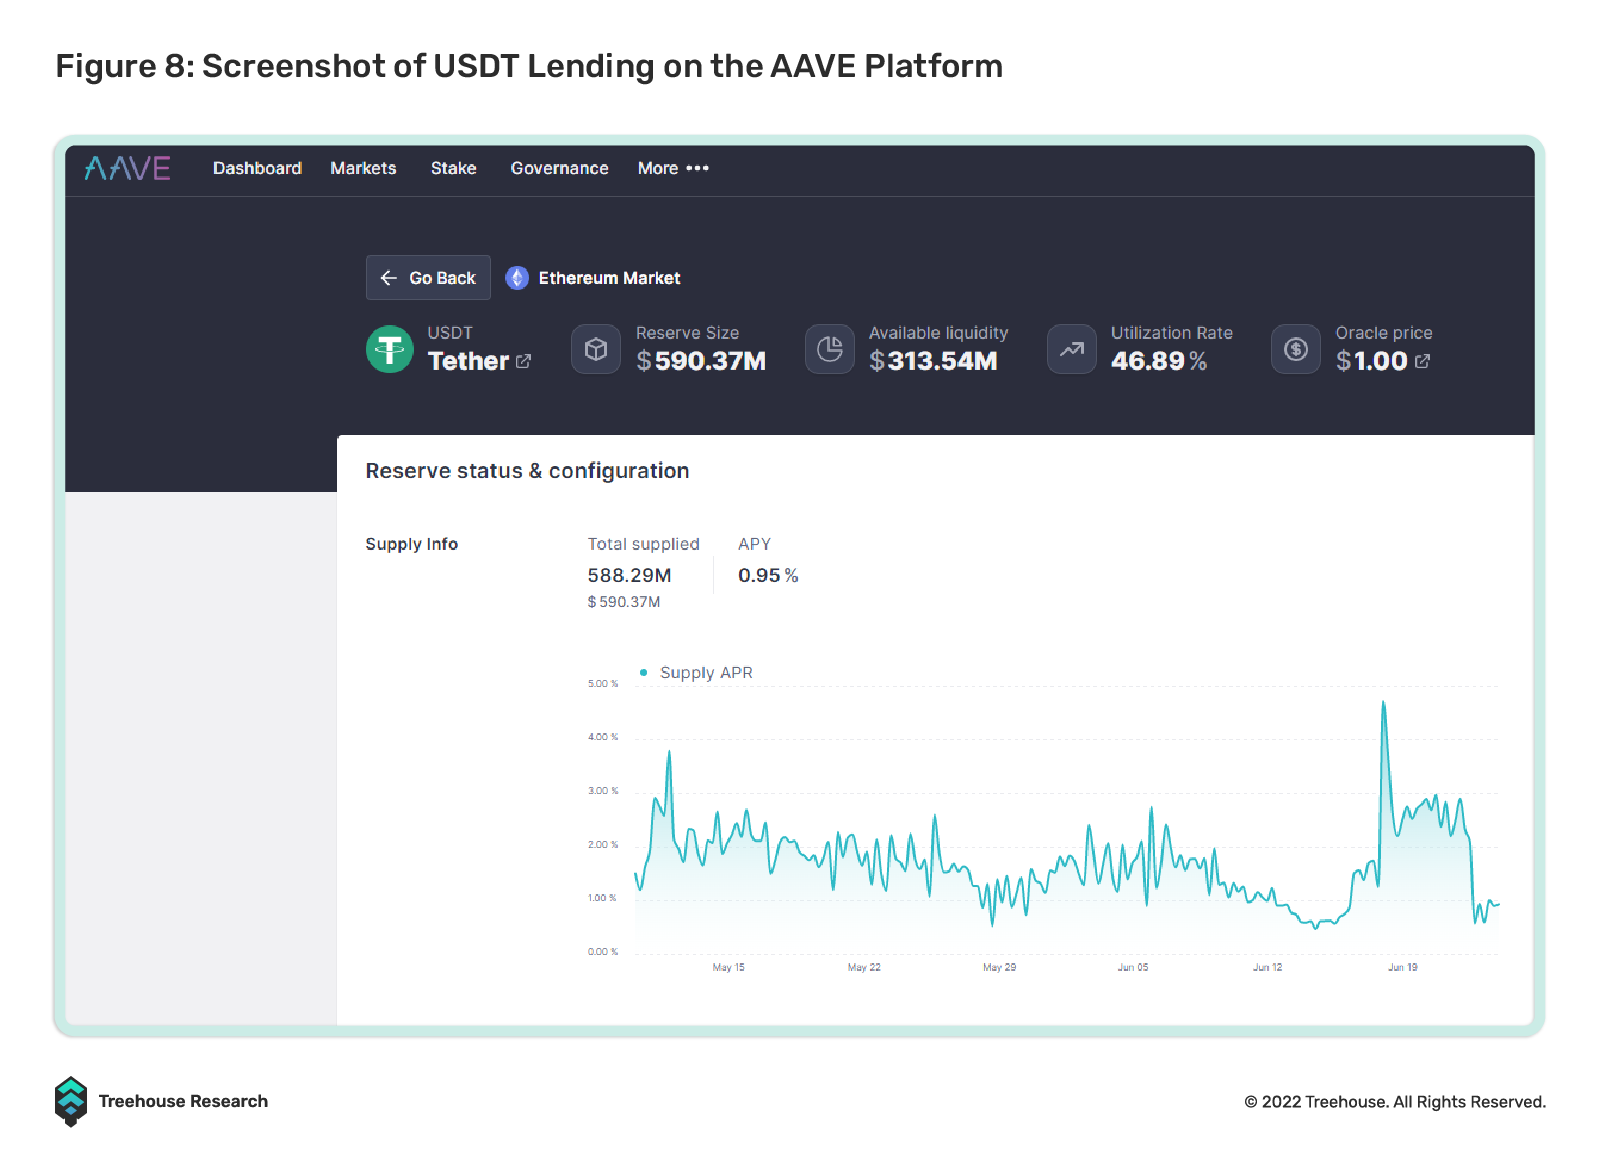
Lending USDT on AAVE gives 0.95% APY. Since AAVE only allows collateralized lending, there is no credit risk. As long as AAVE works as designed, duration risk is negligible as deposits can be withdrawn anytime.
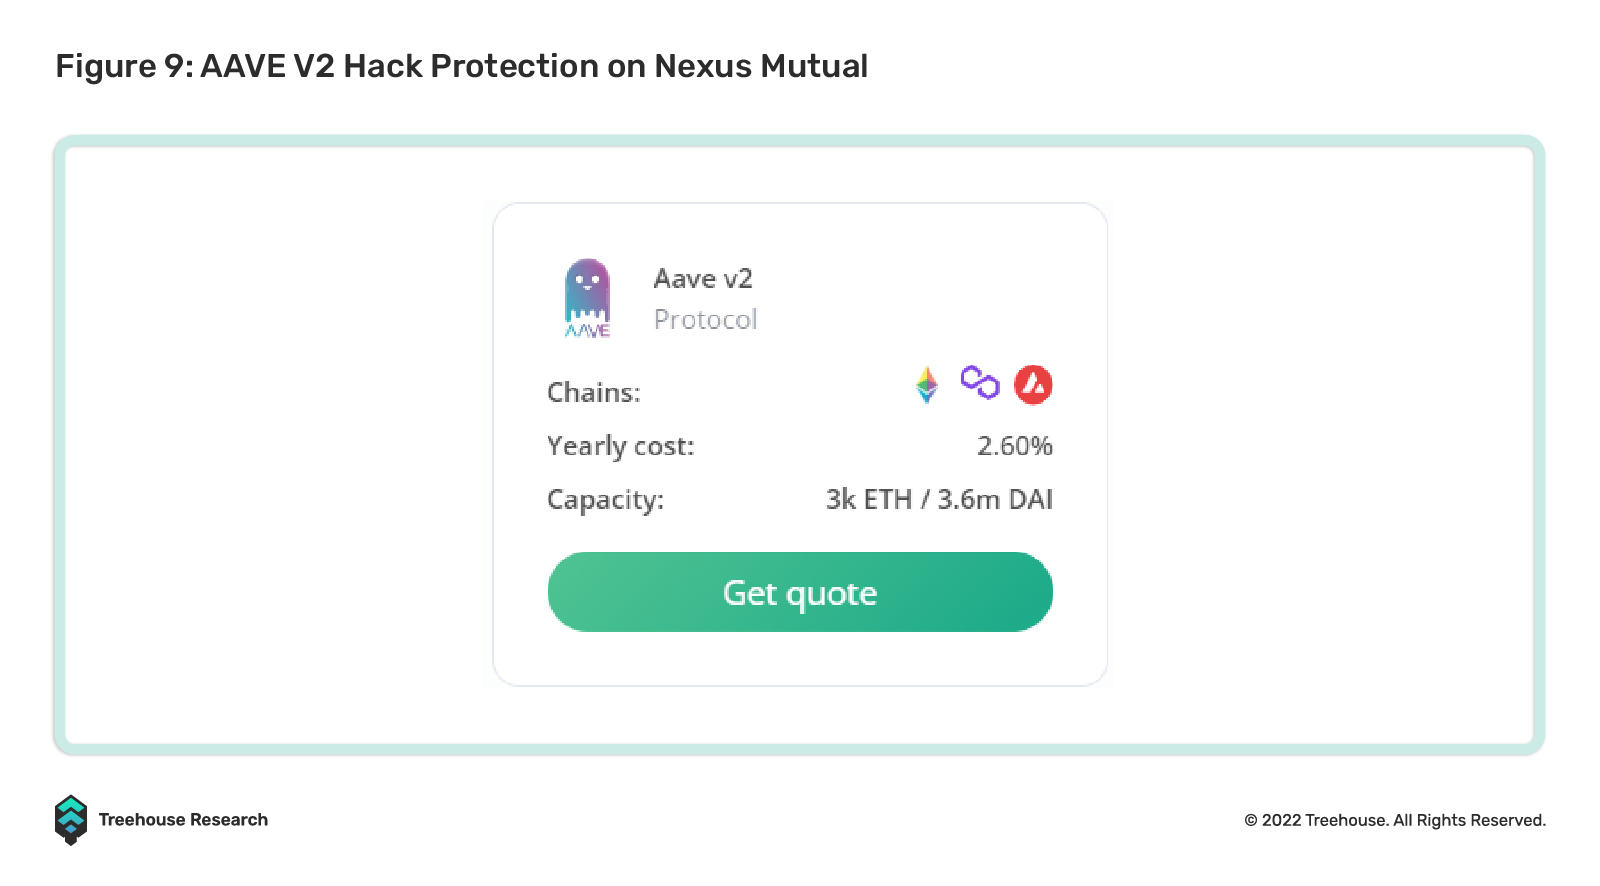
AAVE V3 hack protection costs 2.6% APY on Nexus Mutual (note that covered events might not include losses caused by factors other than malicious and criminal acts).
USDT depeg hedge costs ~3.5% APY on InsurAce.io, but it only covers events if USDT’s 10-day time-weighted average price (TWAP) trades below $0.92. This cover is probably an underhedge against USDT’s depeg risk.
Alternatively, FTX USDT perp costs ~9.63% APY to short (rates vary hourly).

To hedge against Ethereum’s risks (L1 risk premia), FTX’s ETH perp can be used and costs ~0.9% APY to short (note that this rate fluctuates quite a bit).
If FTX perps are used to hedge the above risks, then the hedge to mitigate FTX custodian risk costs ~5% APY on InsurAce.io. Note that InsurAce.io might not cover losses caused by factors other than malicious acts.
All in all, the risk-free rate for this particular AAVE-USDT pool is around -6% before even hedging against custodian risk. This number can be interpreted in one of two ways: the USDT pool yield earned does not sufficiently justify the risks taken by depositors for 0.95% APY, or the total hedging cost is higher than necessary, i.e., the risk premium is overpriced. In the former interpretation, one should stop depositing in the AAVE pool, and in the latter, one could sell their favorite hedges and pocket the premiums.
2. Linear Risks
a. Spot Price Fluctuations
Price movements are the easiest and most vanilla source of return in DeFi. Expected returns from spot price fluctuations can be broken down similarly into factors like the FF Model.
Here are some suggested essays on attempting factor model analysis for cryptocurrency returns:
b. Funding Rates
Funding costs can be high in a liquidity crunch for spot margin borrowers or one-sided markets for perp positions.
3. Borrowing / Lending Risk
DeFi lending is dominated by flexible-term, overcollateralized borrowing and lending, thus removing credit and duration risks. For lenders who engage in longer-duration fixed-term lending, duration risk exists.
Lenders take on the risk of money market protocols becoming insolvent, even with the protection provided by governance token stakers.
4. Liquidity Provision
Liquidity providers (LPs) are exposed to DEX protocol and market risks. The most common form of market risk that LPs face is Impermanent Loss (IL), which refers to the difference between holding an asset and providing liquidity in that asset.
5. Non-Linear Risks
Volatility (vol) risk is the main type of non-linear risk, and it does not just concern option traders. Positions involving purely linear instruments are affected by vol fluctuations too.
Inherently short vol strategies include:
1) HODLing to benefit from long-term spot price rallies, which usually lead to vol decreases
2) Range-bound / mean reversion trading strategies, such as grid trading and dollar-cost averaging (DCA). Grid trading is only profitable when vol is contained, and prices trade in a defined range
3) Entering LP positions, which can be proxies for short straddles due to IL
Inherently long vol strategies include:
1) Momentum-following
2) Buying coverage on DeFi insurance protocols
3) Shorting stablecoin perps (as the payoff is asymmetric, this strategy is similar to longing a systematic tail risk put on the entire crypto space)
In general, buying options is a long vol strategy, and selling options is a short vol strategy.
How to Confidently Navigate DeFi
So far, we have reviewed the standard risk premiums in TradFi and those more specific to DeFi. Despite crypto’s attempts at decoupling from TradFi, it is still largely a USD-denominated, fiat-centric asset class. As a result, crypto investors are inherently exposed to both TradFi and DeFi risk premiums.
Having a clear picture of the explicit and implicit risk exposures is imperative in evaluating whether an investment’s nominal return adequately compensates for the risks taken. However, identifying these risks is only the first step in helping you become a better investor. Calculating them is just as important!
Investors can manually calculate some of the above risks using tools like Excel (equations to calculate risk premia can be readily found online). However, this exercise takes at least a few weeks to complete for complex portfolios. Furthermore, users need to be clear on the accounting standards they adopt, their transaction in and outflows, in addition to tracking each position’s cost basis.
Harvest is a tool created by Treehouse to make institutional-grade DeFi portfolio tracking easy by reading historical on-chain data and breaking down portfolio returns into their associated risk premiums.
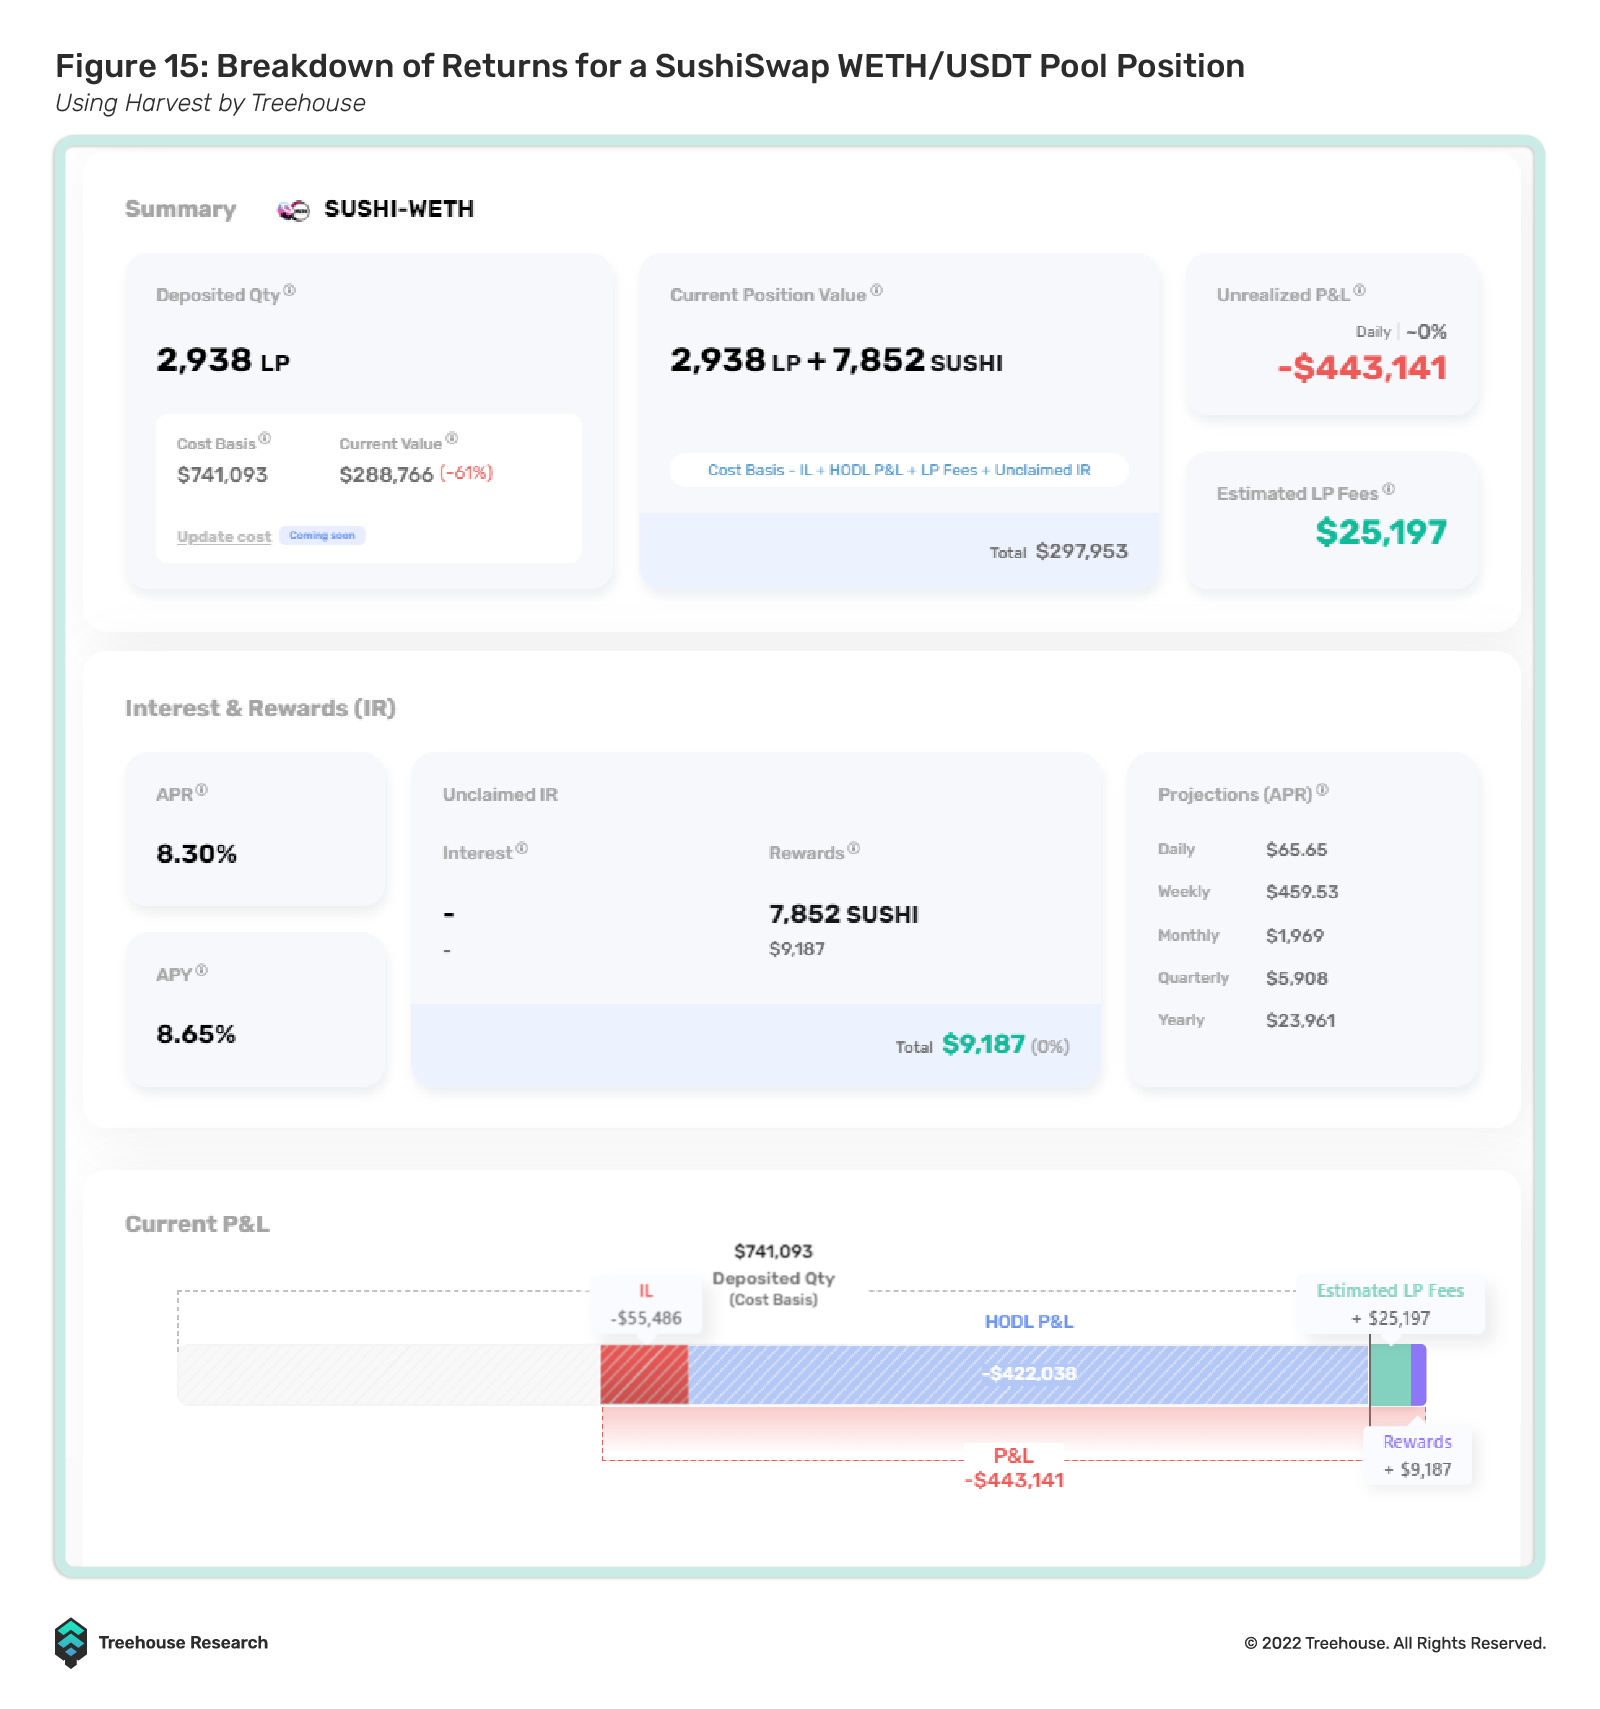
As an example of the app’s capability – assume you entered a WETH/USDT LP position on SushiSwap one year ago but forgot the price you transacted the trade at – by entering your wallet ID into the system, Harvest processes every historical transaction in your wallet and forms a time-series database to pinpoint your estimated cost basis and your position’s P&L attribution.
Figure 15 provides a visualization of your LP position whereby Harvest shows a nominal breakdown of your:
- HODL P&L includes the return from spot price fluctuation risk premium;
- IL plus Estimated LP Fees show the net return from volatility risk premium;
- Rewards show the return from the token rewards SushiSwap emits to incentivize users to provide liquidity, reflecting the smart contract risk premia awarded to early adopters.
From there, users can do deeper dives into the state of their positions, making risk-adjusted assessments on their performance, i.e., figuring out if the IL suffered is greater Estimated LP fees + Rewards, assuming a delta-neutral strategy.
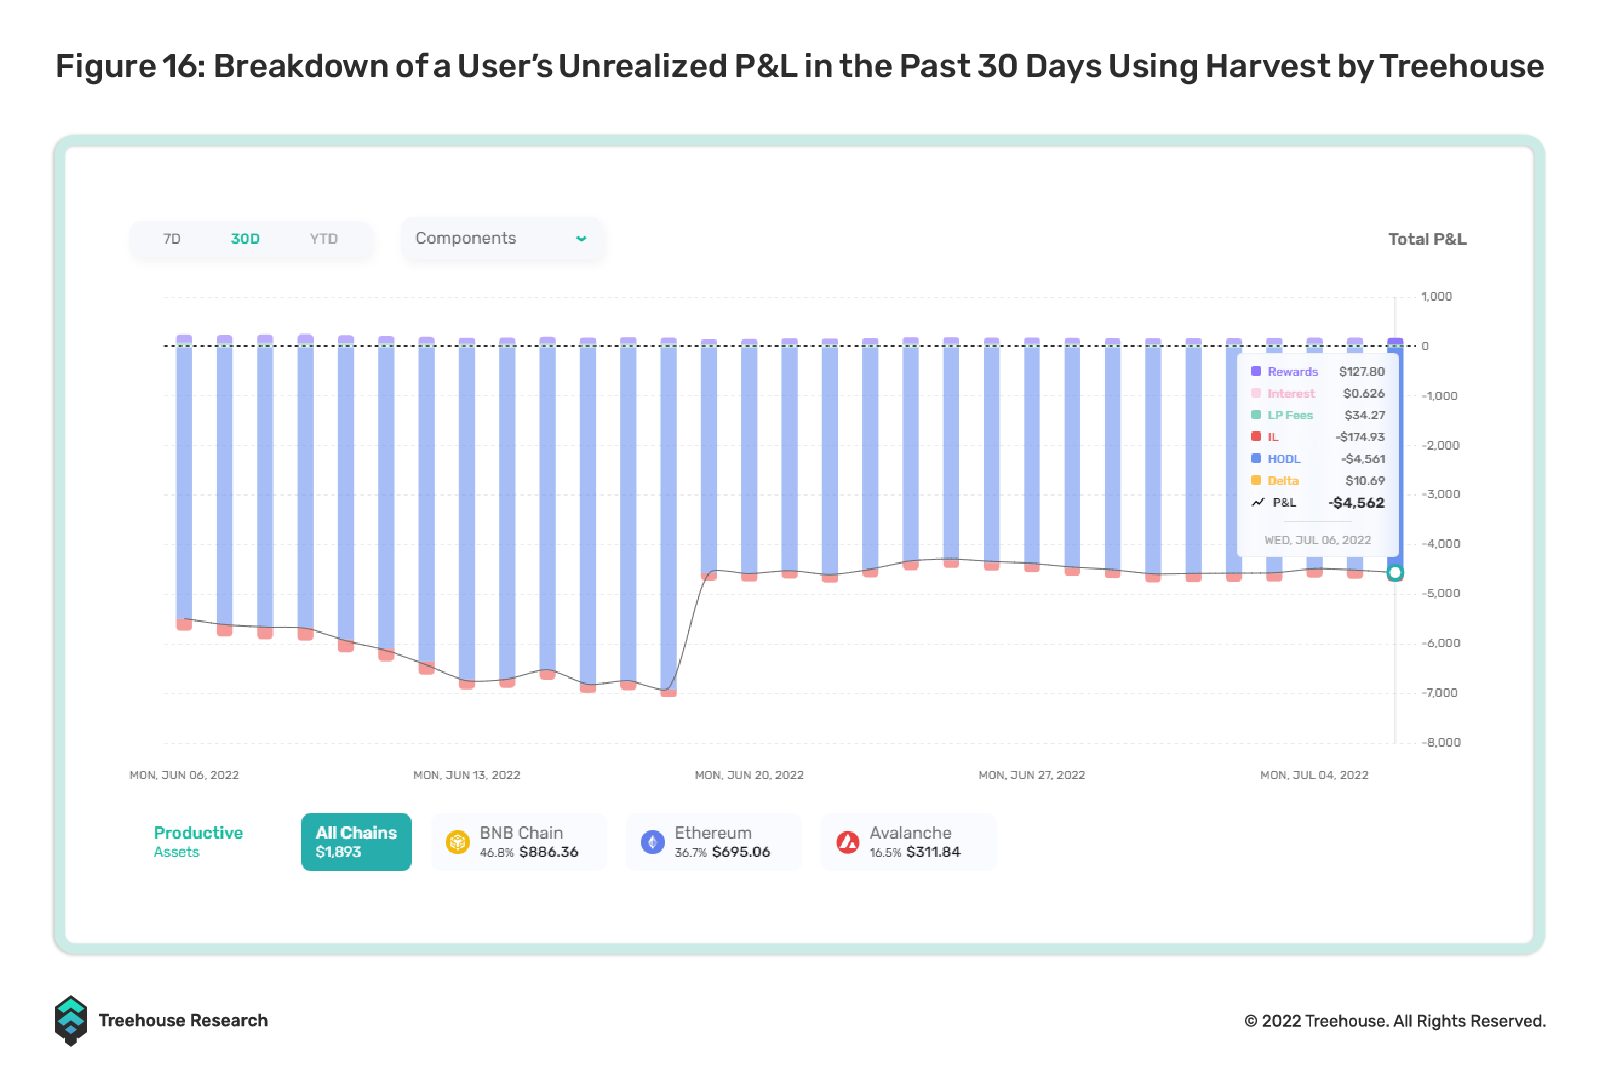
Beyond P&L attribution, Harvest is the only portfolio tracker capable of deconstructing users’ historical P&L into their aforementioned drivers. The platform will soon allow users to customize date range selections to enable users the flexibility of studying portfolio performance during historically volatile periods (i.e., the LUNA meltdown).
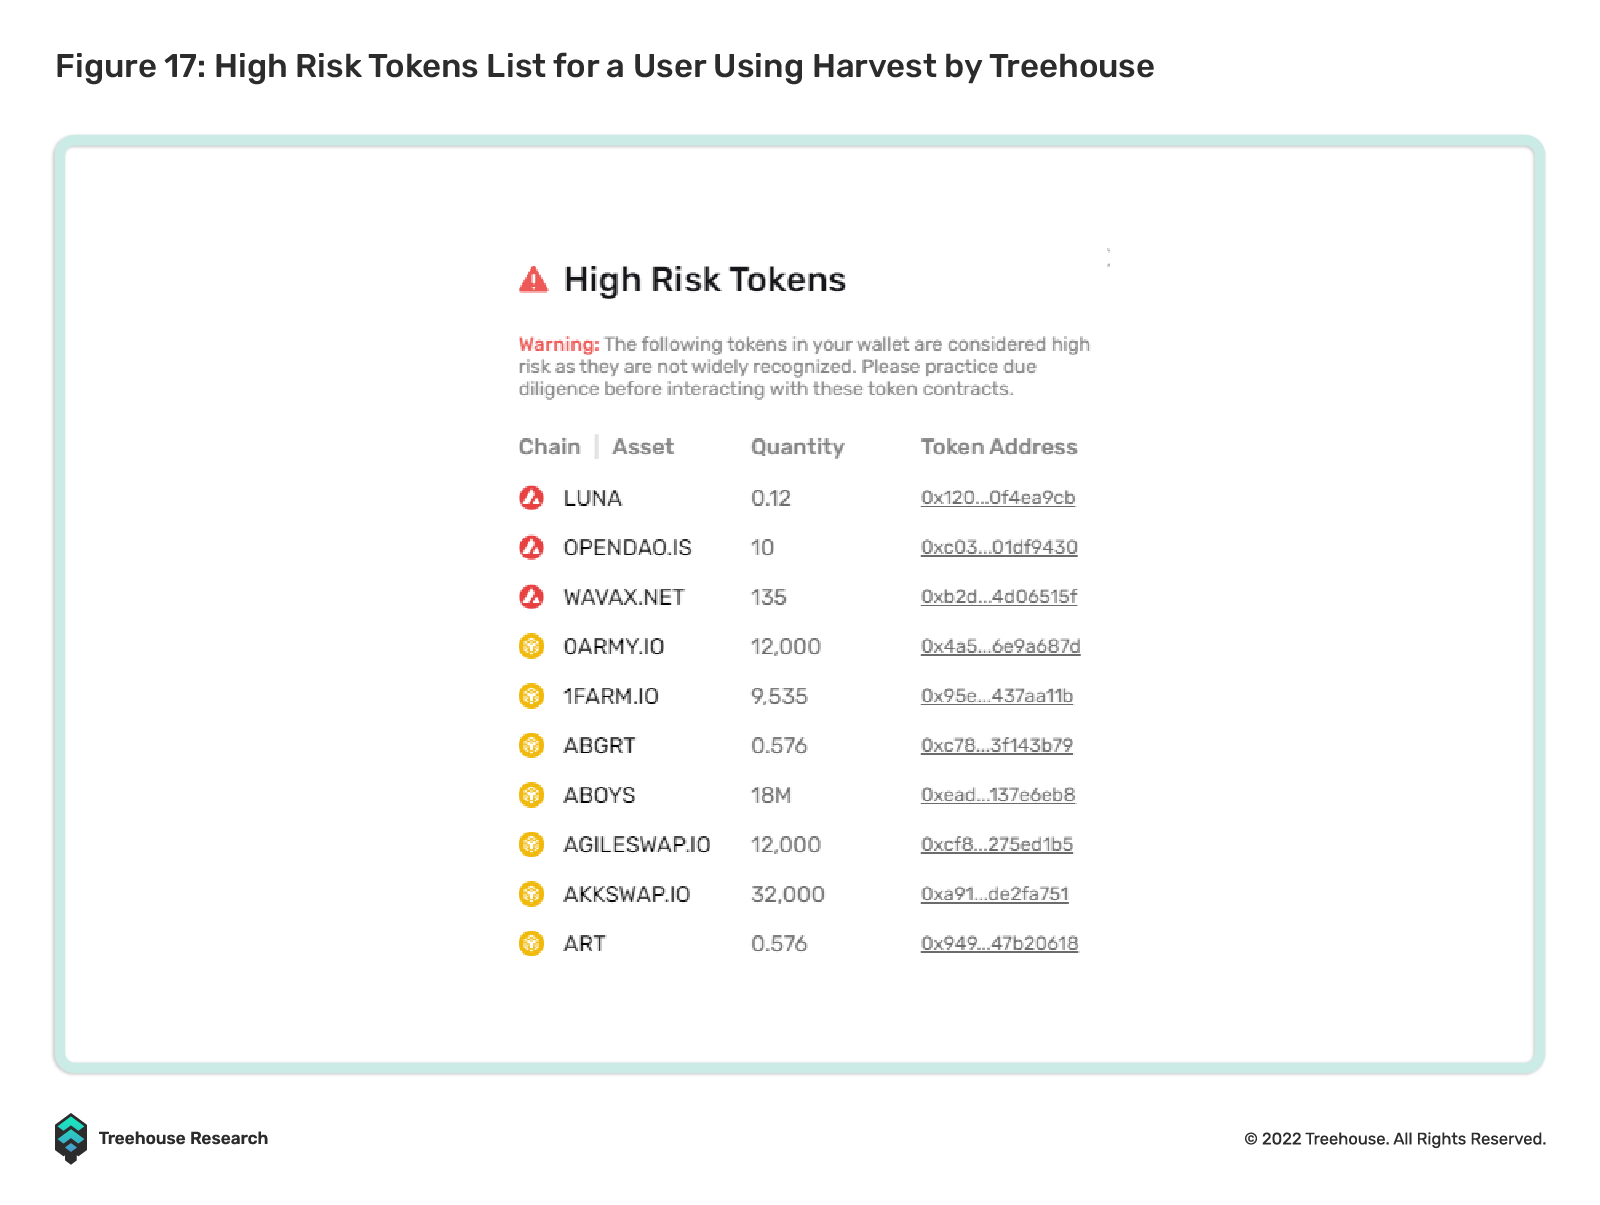
Harvest also scans wallet transactions to highlight high-risk tokens using a proprietary set of criteria to help you further identify protocol credit risks among holdings.
On top of the features mentioned, Treehouse is building an integrated solution serving the full investment life cycle – from idea generation to portfolio management. Expect to see tools that help users identify risk and return opportunities, fine-tune exposures, and manage their portfolios intelligently.
For users and institutions interested to learn more about the full suite of Harvest, check out our product roadmap on our front page, or reach us through support@treehouse.finance, Discord, Telegram, and Twitter. While you are here, take a quick tour of Harvest or try scanning your wallet here to see how well your DeFi investments have performed.
Disclaimer
This publication is provided for informational and entertainment purposes only. Nothing contained in this publication constitutes financial advice, trading advice, or any other advice, nor does it constitute an offer to buy or sell securities or any other assets or participate in any particular trading strategy. This publication does not take into account your personal investment objectives, financial situation, or needs. Treehouse does not warrant that the information provided in this publication is up-to-date or accurate.
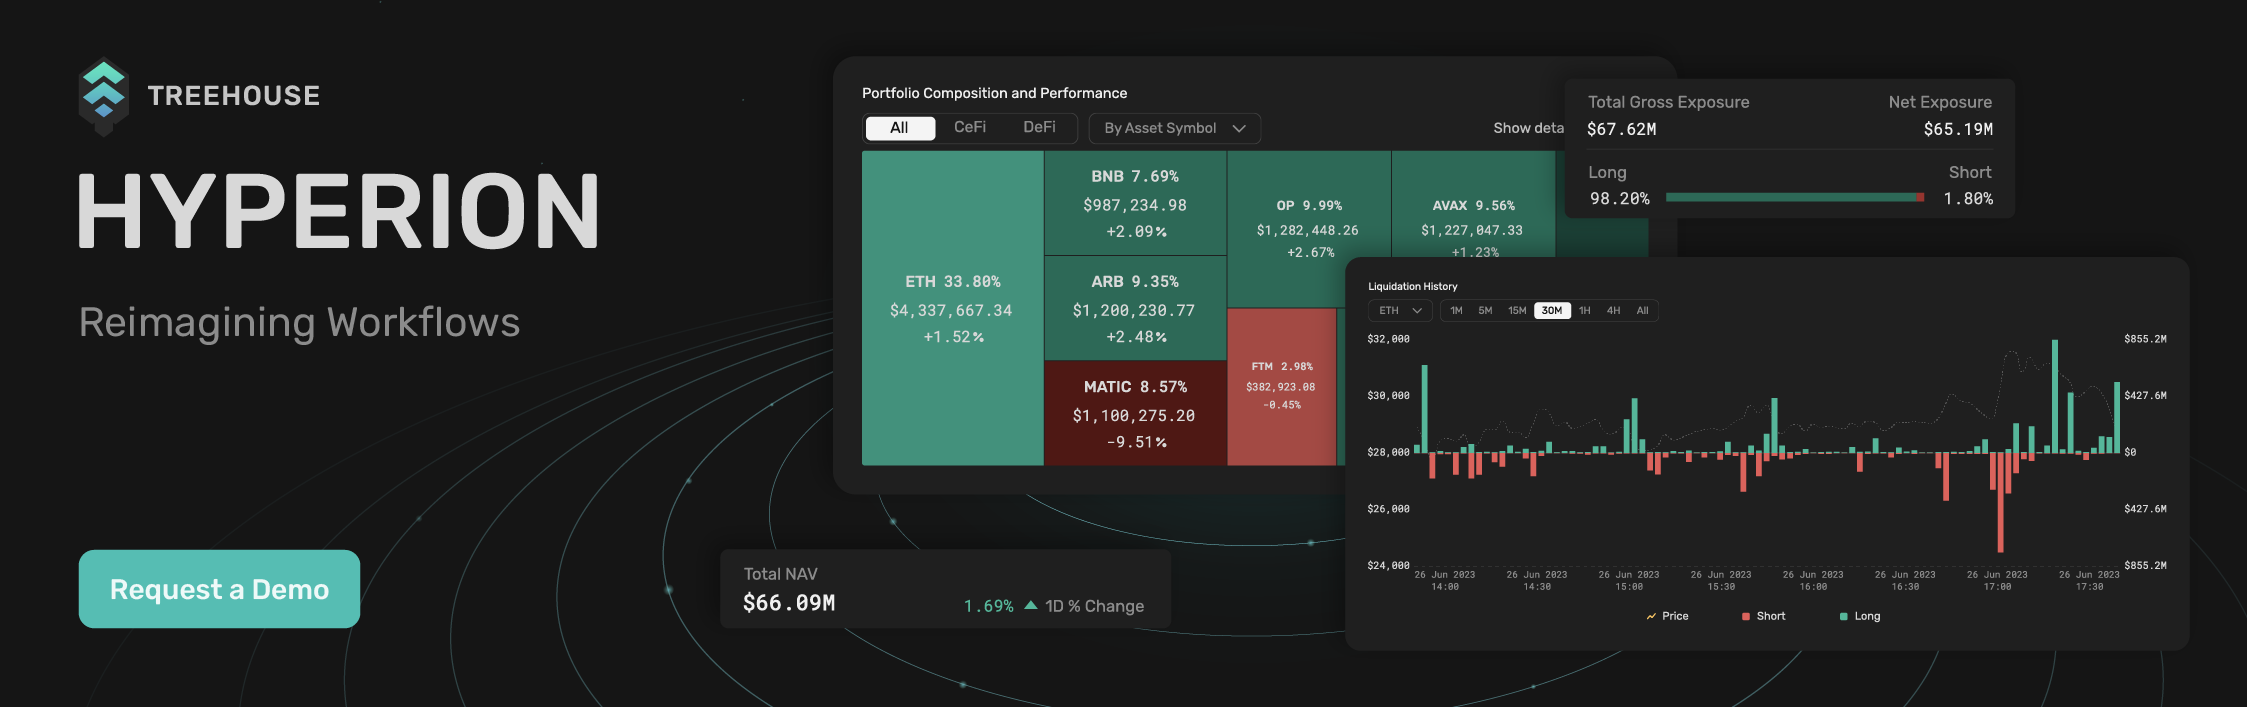
Hyperion by Treehouse reimagines workflows for digital asset traders and investors looking for actionable market and portfolio data. Contact us if you are interested! Otherwise, check out Treehouse Academy, Insights, and Treehouse Daily for in-depth research.